
Download
SURVEY
Streamlined life cycle assessment of packaging waste in coffee preparation and consumption
Mauro Moresi1,2*, Alessio Cimini2
1Accademia dei Georgofili, Firenze, Italy;
2Department for Innovation in the Biological, Agrofood and Forestry Systems, University of Tuscia, Viterbo, Italy
Abstract
The escalating environmental concerns surrounding packaging waste and the drive for circularity, as highlighted by the European Union’s (EU) Packaging and Packaging Waste Regulation, necessitate a thorough assessment of consumer products. This study characterizes coffee production and consumption, including its environmental impact, and conducts a streamlined life cycle assessment (LCA) focused on the use and post-consumer phases of diverse coffee formats to quantify packaging waste per coffee cup and evaluate associated environmental burdens. Eight coffee formats—flexible multilayer bags, pads, and various capsules (aluminum [Al], polypropylene [PP], polyethylene-aluminum-polyethylene terephthalate [PE-Al-PET], polylactic acid [PLA], and paper), alongside innovative coffee balls—and their corresponding brewing systems (Moka pot, espresso machine, pad/capsule machine, and reusable capsules) were considered. Utilizing a functional unit of 720 kg of roasted and ground coffee (RGC), the environmental impact was assessed using the EU product environmental footprint (PEF) methodology. Results conclusively demonstrate that traditional brewing systems using RGC from multilayer bags (PEF: 613±10 nPt/cup) are significantly less impactful than single-serving options such as coffee balls (PEF: 1,675±25 nPt/cup) and particularly capsule/pad systems, such as coffee pads (PEF: 2,895±581 nPt/cup) or PP capsules (PEF: 2,777±23 nPt/cup) across normalized and weighed PEF scores. Detailed analysis further reveals substantial differences in organic and packaging waste generation (e.g., the overall waste from multilayer bags: ≈12 g/cup vs. coffee pads: 22.1 g/cup), carbon footprint (e.g., greenhouse gas [GHG] for multilayer bags: 8.2 g CO2e/cup vs. PP capsules: 41 g CO2e/cup), fossil resource use, and water use per single coffee cup, underscoring the disproportionate environmental burden of single-serve options. While traditional systems demand more consumer efforts (e.g., filling portafilters and discarding spent ground coffee), their environmental benefits are clear and quantifiable. This study identifies critical environmental hotspots and provides evidence-based recommendations to align coffee consumption with evolving the EU regulations, advocating for more sustainable practices in product design and consumer choice.
Key words: brewing systems, coffee balls, coffee capsules/pods, espresso coffee, ground coffee, Life Cycle Assessment (LCA), Moka pot, packaging and packaging waste regulation (PPWR), packaging-to-ground coffee ratio, product environmental footprint (PEF)
*Corresponding Author: Mauro Moresi, Accademia dei Georgofili, Firenze, Italy. Email: [email protected]
Academic Editor: Prof. Monica Rosa Loizzo – University of Calabria, Italy
Received: 11 June 2025; Accepted: 31 July 2025; Published: 1 October 2025
© 2025 Codon Publications
This is an Open Access article distributed under the terms of the Creative Commons Attribution-NonCommercial-ShareAlike 4.0 International (CC BY-NC-SA 4.0). License (http://creativecommons.org/licenses/by-nc-sa/4.0/)
Introduction
Coffee is a globally cherished beverage, with a prominent place in the daily lives of humans in Europe and North America. The sheer scale of its consumption is evident in the approximately 2.25 billion cups savored globally annually (Yaqub, 2025). Within this global landscape, Italy exhibits a significant appetite for coffee, with a consumption of roughly 384,000 metric tons (MT) of roasted and ground coffee (RGC) in 2022 (World Population Review, 2025).
Numerous studies have explored the environmental impacts of coffee, particularly focusing on cultivation and preparation methods. Life cycle assessment (LCA) studies consistently identify cultivation and consumer–use phases as key contributors to greenhouse gas (GHG) emissions and other environmental burdens (Coltro et al., 2006; Humbert et al., 2009; Noponen et al., 2012). This was also confirmed by a recent review conducted by Chéron-Bessou et al. (2024), which highlighted these phases despite significant variability observed across different coffee LCA studies. Within the cultivation phase, land use change, fertilizer use, and wastewater discharge are notable contributors, while in the consumer–use phase, energy consumption during brewing and packaging waste generation are particularly significant.
Comparative LCA studies have yielded varied results depending on methodological choices, functional units, and local practices. For instance, while aluminum (Al) capsules often demonstrate favorable outcomes because of their recyclability, biodegradable options may perform poorly in landfill conditions (Dubois et al., 2011). Single-serve systems generally show advantages in reducing coffee waste and improving dosage efficiency (Chayer and Kicak, 2015) despite higher packaging intensity.
With increasing environmental awareness, the packaging stage has come under renewed scrutiny. The revised European Union (EU) Packaging and Packaging Waste Regulation (PPWR), which entered into force on 11 February 2025 after 2 years of intense negotiations between EU institutions (Schwizgebel et al., 2025), marks a turning point in how packaging is assessed and managed across all member states. Unlike its predecessor, Directive 94/62/EC (European Union [EU], 1994), the PPWR is a directly applicable regulation, standardizing requirements across EU states.
Key PPWR mandates relevant to coffee packaging include the following:
-
Recyclable packaging by 2030, with large-scale recycling operations in place by 2035.
-
Minimum 10% post-consumer recycled (PCR) content in plastic packaging that ensues contact with food.
-
Eco-modulation of extended producer responsibility (EPR) fees based on recyclability and environmental performance.
These rules particularly impact single-serve coffee formats, because there are insufficient solutions (Marinello et al., 2021) for the treatment of such waste on a global scale from its appropriate collection to the treatment and enhancement of materials that are recovered (plastics, metals, and spent coffee grounds [SCGs]). Specifically, since coffee capsules are made from different materials, the need to separate manually poly-laminate components and coffee residues is one of the main challenges. Thus, the capsules frequently end up in undifferentiated collection mainly disposed of in landfills or incinerators, as separating the plastic part from the aluminum part is not a simple operation. Consequently, owing to the EPR schemes promoted by the PPWR, producers are potentially be enforced to innovate in capsule design or recycling systems, as they are responsible for the end-of-life management of their packaging. Furthermore, the PPWR encourages the reduction of complex materials in packaging, recognizing that the combination of different materials in coffee capsules (plastic, aluminum, and coffee) complicates recycling efforts, potentially driving the industry toward mono-material or easier-to-separate designs.
Considering the PPWR’s focus on reducing packaging waste and promoting circularity, the first aim of this study is to characterize the basics of coffee in terms of varieties, types, production and consumption processes, and environmental impact. The second one was to adopt a streamlined LCA approach to evaluate the use and post-consumer phases of different coffee formats, particularly focusing on the amount of packaging waste per coffee cup. This targeted assessment was justified by the following three key factors:
-
The PPWR’s prioritization of minimization and recyclability of packaging waste.
-
A significant environmental burden posed by packaging in single-serve coffee systems, a segment with rapidly increasing market share.
-
The necessity of comparing environmental impacts under consistent downstream conditions, utilizing the product environmental footprint (PEF) methodology (European Commission, 2018), as integrated into the SimaPro software (PRé Consultants, Amersfoort, NL).
By isolating these specific life cycle stages, this study effectively identifies crucial environmental hotspots. This provides a strong basis for evidence-based recommendations, helping to align coffee consumption practices and product design with the EU’s evolving regulatory framework.
Coffee Basics
Coffee is the third largest consumed drink globally after water and tea. It is brewed from roasted and ground seeds of coffee plants, their constituent alkaloid (i.e., caffeine) giving such a beverage a stimulating effect. Although there are about 124 varieties of coffee plants (World Bank, 2020), two species, Coffea arabica and C. canephora, supply almost all the world coffee consumption. Arabica beans contain about 1.5% of caffeine and yield a milder, sweeter, and more flavorful and aromatic brew than Robusta ones, their caffeine content being about 2.7%. C. arabica is believed to be a native of Ethiopia and is more widespread than C. canephora, but more vulnerable to fungal diseases (i.e., coffee leaf rust) and pests (i.e., coffee berry borer). It must grow at altitudes ranging from 600 to 2,000 m above sea level (asl), needs rainfall of 1.5–2.0 m per year, and a dry period of 2–3 months or irrigation if rainfall is of less than 1 m/year; it has specific shade requirements. On the contrary , C. canephora, native to West Africa, can grow at lower altitudes than 600 m asl. It is greatly tenacious and adaptable for its resistance to high temperatures (24–30 °C) and humidity as well as attacks by insects; its high caffeine content acts as a natural pesticide.
Green coffee production
Global green coffee production reached more than 178 million 60-kg bags in the 2023–2024 season (Shahbandeh, 2025), rebounding from 168.2 million 60-kg bags in 2022–2023 and 170.8 million 60-kg bags in 2020–2021, despite the disruptions caused by the COVID-19 pandemic (International Coffee Organization [ICO], 2022). South America accounted for approximately half of global production, with Brazil being the largest producer at 69 million 60-kg bags, followed by Vietnam with 29 million 60-kg bags (Shahbandeh, 2025).
International coffee trade remains highly dynamic. Global imports for 2023–2024 reached 137 million bags, led by the United States ($8.2 billion), followed by Germany ($4.12 billion), Canada, and the Netherlands (Ridder, 2024).
Brazil, Switzerland, and Germany were the leading exporters in 2024 (Ridder, 2025). Certified sustainable coffee also has shown steady growth, with Fair Trade- and UTZ-certified (UTZ also means “good” in the Maya language) production increasing from 0.87 million MT in 2016 to 1.7 million MT in 2023 (Shahbandeh, 2024).
In terms of species, Arabica continues to dominate global production, accounting for 59.2% in 2020–2021 and maintaining a 57.5% share in 2022 (98.6 million bags vs. 72.7 million bags of Robusta variety) (Maletic, 2023). Arabica is primarily cultivated in South America, while Robusta dominates Asia and Oceania (60%), followed by South America (28%) and Africa (12%). In the EU27 states, imports in 2023 reflected a stable split of 63.8% Arabica and 35.6% Robusta (European Coffee Federation, 2024).
Italy remains a key player as both importer and exporter. In 2023, the Italian coffee industry generated a turnover of approximately €5.2 billion, with €2.3 billion from exports and €2.9 billion from domestic sales (Italia Insights, 2024). Italy ranks as the world’s third largest importer of green coffee, outsourcing primarily from Brazil (31%), Vietnam (23%), Uganda (15%), India (8%), and Indonesia (3%) (Redazione Beverfood.com, 2024). The average purchase price of green coffee stood at €3.1/kg, with Robusta at €2.4/kg and Arabica at €3.7/kg (Redazione Beverfood.com, 2024).
Domestically, coffee remains deeply embedded in Italian culture, with 97% of the population consuming it regularly; 89.3% drink it at least on weekly basis and 73.9% daily (Redazione Beverfood.com, 2024). Coffee is widely perceived as both an energizer (42.2%) and a social ritual (33.7%), with preparation considered important by 92% of consumers, particularly among those aged 25–34 years (95%) (Redazione Beverfood.com, 2024).
In 2023, domestic roasted coffee consumption through retail channels totaled 120.9-million kg, accounting for 71% of roasted coffee sales. Retail volume declined by 2.2%, compared to 2022, due to inflationary pressures; however, market value rose by 6.1% to €1.729 billion, as average prices increased from €13.2/kg to €14.3/kg (+8% increase) (Redazione Beverfood.com, 2024).
Packaged ground coffee remains the leading segment (68% volume, and 45% value), while single-serve formats continue to expand. Capsules now account for 20.3% of volume and 44.2% of value, generating more than €639 million; coffee pods contributed €126 million (Redazione Beverfood.com, 2024). Coffee beans represent 7.3% of volume (4.9% value), and soluble coffee remains marginal (4% volume, and 6% value).
Supermarkets dominate distribution (58.4% of value), followed by discount stores (15.0%), hypermarkets (12.4%), large-scale retailers (10.4%), and traditional retail (3.8%). Specialized coffee shops and online channels account for ~18% of the market (41 million kg), with 22% of consumers purchasing from specialty stores and 9% directly from roasters (Redazione Beverfood.com, 2024).
Brewing preferences in Italy have shifted significantly over the past decade. While the Moka pot was once the dominant method, used by 87% of households in 2016 (Agenzia Giornalistica Italia [AGI], 2016), its popularity has since declined. By 2021, Moka pot usage dropped to 39%, remaining the leading home brewing method, with pod machines as a close second at 31% (YouGov(R), 2024). This trend accelerated, and by 2023, pod machines had firmly established their lead with a 42.7% market share, followed by Moka pots (28.8%) and automatic espresso machines (17.1%) (Italia Insights, 2024).
Although RGC still represents 90% of domestic consumption, single-serve systems are driving market transformation. Exports of pods and capsules increased by 12.9% in 2024, now comprising 40% (€595 million) of Italy’s coffee market (Italia Insights, 2024). Aluminum capsules grew by 11% since 2016, while decline was observed in plastic and paper pods (Iascone, 2020; Italia Insights, 2024).
Finally, sustainability concerns are increasingly relevant, with 50.3% of consumers demanding greater environmental responsibility across the coffee supply chain. Industry responses include investments in ethical sourcing, eco-friendly packaging, energy efficiency, and circular economy practices (Redazione Beverfood.com, 2024).
Globally, per capita coffee consumption varies considerably. In 2023, Brazil led with 6.4 kg per capita, followed by Canada (6.2 kg), the EU27 considered as a bloc (5.7 kg), and the United States (4.8 kg). Notable variations within the EU27 itself were noted: Finland (10.5 kg), Sweden (9 kg), Italy (5.5 kg), and France (5.2 kg). Meanwhile, emerging markets, such as Indonesia (1.3 kg) and Russia (2.0 kg), are still on an upward trend (European Coffee Federation, 2024).
Coffee cultivation and green coffee production
Coffee plants were customarily cultivated in the shade of different trees to mimic the natural growing conditions of a forest understory. This method not only provides habitat for pest-eating birds and pollinators but also has several advantages, such as improved nutrient cycling, carbon sequestration and water filtration, and decreased soil erosion. Even if it is characterized by yields of 0.5–1.0 MT per hectare (ha) and is more labor-intensive, the harvested beans have a superior flavor and thus a higher market price, being sold as a specialty coffee. In 2021, about 25% of global coffee production was shade-grown. Sun-grown coffee has been cultivated since 1960s and has caused the deforestation of large areas of Central America and other coffee-growing regions. Robusta coffee is well adapted to such a cultivation method with yields as high as 2.3–3.4 MT/ha, thanks to greater treatment inputs (i.e., trimming, weeding, fertilizers, and pesticides). Young coffee plants, raised in nurseries, are spaced in rows with a density ranging from 1,200 to 1,800 plants/ha at the beginning of the rainy season, and start producing fruit 3–4 years later.
Table 1 shows the main agricultural activities and inputs applied in the main coffee-growing areas, such as Brazil, India, Indonesia, Vietnam, Honduras, and Colombia, as well as the average green coffee bean (GCB) yields, as extracted from the Ecoinvent v. 3.5 database.
Table 1. Main agricultural activities and inputs applied in the main coffee-growing areas, such as Brazil, India, Indonesia, Vietnam, Honduras, and Colombia, as well as the average crop yields of green coffee beans (GCB) of Arabica and Robusta varieties, as extracted from the Ecoinvent v. 3.5 database.
| Coffee variety | Locality | Average crop yield (kg GCB/ha) |
Irrigation (m3/ha) | Fertilization and pesticide inputs (kg/ha) |
Production period (years) |
Activities |
|---|---|---|---|---|---|---|
| Arabica | Sao Paulo State, Brazil | 1,800 | 1,987 | Mineral NPK fertilizer: 173-35-247 Pesticide: 7.8 |
20 | Tree nursery; soil cultivation; planting trees; direct field emissions; land use change; seedlings, fertilizers and pesticides plus their packaging; irrigation; harvesting; GCBs drying using firewood; waste treatment; final orchard clearing. |
| Robusta | Sao Paulo State, Brazil | 4,200 | – | Mineral NPK fertilizer: 340-56-375 Pesticide: 5.8 |
20 | |
| Arabica | Karnataka State, India | 725 | 352 | Mineral NPK fertilizer: 900-0-0 Pesticide: 3.85 |
20 | |
| Robusta | Karnataka State, India | 1,550 | 235 | Mineral NPK fertilizer: 343-223-221 Pesticide: 2.0 |
20 | |
| Robusta | Lampung province, Indonesia | 900 | – | Mineral NPK fertilizer: 900-0-0 Pesticide: 0.0 |
20 | |
| Robusta | Vietnam | 2,500 | 833 | Mineral NPK fertilizer: 331-127-249 Pesticide: 0.5 |
20 | |
| Arabica | Honduras | 1,340 | – | Mineral NPK fertilizer: 343-223-221 Pesticide: 2.0 |
20 | |
| Arabica | Colombia | 597 | 2,200 | Mineral NPK fertilizer: 118-8-71 Pesticide: 4.3 |
20 |
Notes: NPK: nitrogen-phosphorous-potassium.
The ripened fruits of coffee plants (i.e., coffee cherries) are processed to dry coffee seeds as freed from their pulp and skin using the dry, wet, or semi-washed process. The resulting green coffee is graded and classified on the basis of several characteristics, such as growing altitude and region, botanical variety, method of processing, roast appearance, and bean size, density, and defects. Some shade-grown coffee may be certified as organic (Freitas et al., 2024).
Coffee processing
At roaster companies, GCBs are separated from fibers and powders, vacuum-cleaned, and then stored in silos. Their roasting is generally carried out in rotating drums, where coffee beans are first dried to eliminate any residual moisture and then roasted at temperatures gradually increasing up to 180–250 °C for a period ranging from 7 to 20 min to obtain lighter or darker roasted coffee beans (Freitas et al., 2024). Such a step allows the development of the characteristic aroma of coffee, which is derived from Maillard reactions between carbohydrates, proteins, and acids. A few precursors of the resulting volatile compounds are related to the coffee variety, weather conditions at origin, level of maturation, and processing choices. The level of roasting can give rise to pleasant (i.e., roasted notes from 2-methylpyridine, nuttiness from pyrazines, caramel notes from furans, and furanones, fruity, and sweet notes from 3-methylbutanal and ketones) or unpleasant (i.e., ashy and smoky aromas from guaiacol) aromas (Fisk et al., 2012). Robusta beans can be intentionally over-roasted at near 200 °C to rid it of its natural harshness.
Roasted beans are then air-cooled to maintain their characteristic flavor and avoid any water reabsorption. A fraction of whole roasted coffee beans is directly packaged in flexible sealed bags provided with one-way vent valves, these opening to relieve increased pressure due to the release of CO and CO2 trapped within cooled roasted coffee beans (McCarrick et al., 2019). These are generally ground at the time of purchase or consumption. By contrast, the great majority of roasted coffee beans is immediately ground and packed by the manufacturer. Such a process is a key step—the degree of particle fineness affecting the taste and flavor of coffee. If coffee particles are too coarse, water filters through too fast to extract wholly the aroma substances contained in coffee beans. On the contrary, too fine particles filter water too slowly and entrain smaller particles that deposit at the bottom of the cup. Not only the particle size of the coffee powder is to be adjusted but the particle size distribution is also controlled to assure a harmonious coffee taste in pre-set brewing period. For these reasons, laser particle size analyzers are used in industries to guarantee the required size of the coffee powder of choice (Wang, 2021).
Coffee powder packaging
Given the ground coffee’s extreme sensitivity to air and moisture, these causing rancidity through the oxidation of fatty components and deteriorating its aromatic qualities within a few days, specialized packaging is crucial. To combat these issues, coffee is typically packaged under vacuum or in an inert gas in hermetically sealed containers. These containers are crafted from multilayer or composite materials (often involving coextrusion or lamination of kraft paper, aluminum foil, and low-density polyethylene [PE] or polypropylene [PP]), stainless steel, or plastic cans. This construction provides essential barrier properties, strength, and storage stability, extending coffee powder’s shelf life to 3–5 months.
For ultimate freshness and convenience, ground coffee is often portioned into small, disposable, airtight containers: capsules and pods. Coffee capsules are designed to maintain coffee freshness by creating a sealed, oxygen-free environment.
While well-known Nespresso® Espresso capsules are primarily made of aluminum, other commercial capsules utilize a variety of materials, such as the following:
-
Polypropylene, aluminum, and PE
-
Polypropylene and polyethylene terephthalate (PET)
-
Polylactate and starch (these often require additional protection from multilayer pouches made of PE, Al, and PET)
-
Polyethylene, Al, and PET with two upper and lower aluminum lids
These diverse material choices reflect ongoing efforts to balance barrier performance, cost, and environmental considerations.
In contrast, coffee pods are typically made of heat-sealable paper or abaca-fiber filter. To ensure their freshness, pods are commonly wrapped in PE-Al-PET pouches (Cibelli et al., 2021).
Beyond traditional methods, there is a growing interest in sustainable packaging solutions. This includes the exploration of biopolymer coatings for single-serving coffee portions, aiming to reduce reliance on conventional plastics and aluminum while maintaining product integrity. Other emerging trends in coffee packaging include the following:
-
Degassing valves: For freshly roasted coffee, which releases CO2, one-way degassing valves are often incorporated into packaging. These valves allow CO2 to escape without letting in the oxygen, thus preventing package rupture and preserving freshness.
-
Sustainable materials: The industry is increasingly focused on developing and implementing more environment-friendly packaging. This includes recyclable, compostable, and biodegradable materials as well as innovative approaches such as refillable systems and reduced material usage.
-
Active packaging: This advanced packaging technology incorporates components that interact with coffee to extend shelf life and maintain quality. Examples include oxygen scavengers that actively absorb oxygen within the package (Ahmed et al., 2022; Kadirvel et al., 2025).
-
Smart packaging: While still nascent, smart packaging for coffee could involve indicators that signal freshness levels or even QR codes providing detailed information about the coffee’s origin and roasting date (Vasuki et al., 2023).
The evolution of coffee packaging continues to prioritize the maintenance of coffee’s delicate aroma and flavor, extending its shelf life, and increasingly minimizing its environmental impact.
Coffee preparation
Generally, coffee is consumed just after it has been brewed, that is fresh and hot. In the Neapolitan style, not only coffee but also ceramic cup is very hot, both burning the tongue and lips and masking the full perception of coffee flavor. Generally, expert coffee tasters wait from 5–6 minutes before assessing the quality of coffee. While the coffee flavor profile is better appreciated at 70–85 °C (Environmental Product Declarations (EPD), 2019a, 2019b), the water brewing temperature should range from 90 °C to 96 °C to extract flavor and aroma from ground coffee more effectively (Henris, 2023). For this reason, the great majority of expresso coffee makers are designed to keep the temperature of water approximately constant during any brewing cycle.
One coffee serving is quite variable with a coffee powder dose ranging from 5 to 10 g/cup in the case of espresso coffee (EPD, 2019b), and from 14 to 19 g for preparing three cups of Moka coffee (EPD, 2019a). Different coffee capsules are used to prepare 40-mL cup of espresso (Dubois et al., 2011) or Moka coffee (Cibelli et al., 2021). Nevertheless, the volume of a coffee cup can range from 110 mL in Switzerland (Quantis, 2024) or 125 mL in Germany (Brommer et al., 2011) to 150 mL in Thailand (Phrommarat, 2019) or 8-oz (~236.6 mL) in Canada (Chayer and Kicak, 2015). Obviously, the caffeine content of a coffee cup depends on bean variety, roasting degree, brewing method, amount of ground coffee used, and serving size. For instance, Arabica and Robusta beans contain 34–39 g and 69–82 g of caffeine/kg of dry coffee, respectively (Jeszka-Skowron et al., 2016). An 8-oz serving of brewed coffee typically contains 80–100 mg of caffeine, while the same cup of decaffeinated coffee contains as little as 2 mg of caffeine (Medical News Today, 2023).
Different coffee brewing methods are used globally, and are roughly divided into the following five categories (Shabbir, 2024):
-
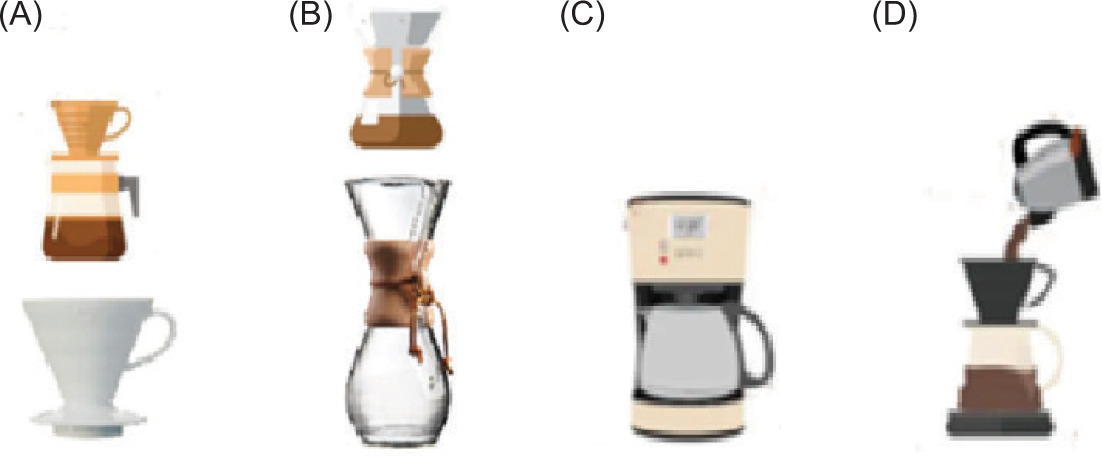
Gravitational potential energy-based coffee brewing: Boiling water is slowly poured over a bed of ground coffee placed on a paper filter to let water naturally drip through it and collect the extract into a container or a cup. Generally, a plastic or ceramic funnel with ribs along its sides and a large opening at the bottom is used to accommodate paper filter and ground coffee. The main devices in use, such as Harrio V60 filter, Chemex, drip coffee maker, and Kalita wave device, are shown in Figure 1.
The paper filter used in the Chemex device is folded two or three times around ground coffee and this results in longer extraction period (3.5 vs. 3.0 min). Moreover, the bottom of the Kalita Wave funnel is flat and provided with three small holes, this making the coffee quality practically independent of the water pouring speed.
-
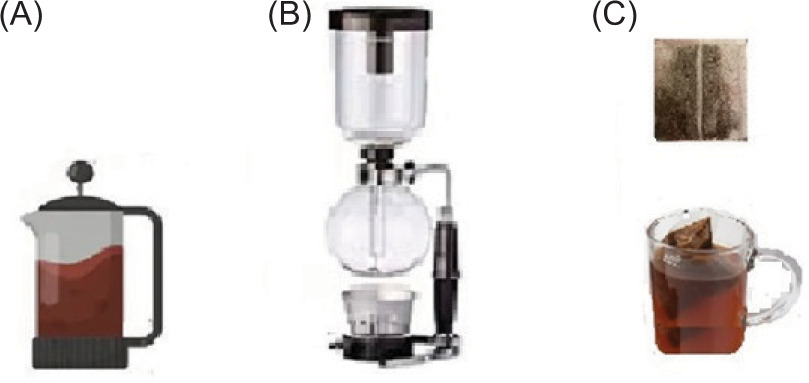
Immersion- or steeping-based coffee brewing: Ground coffee of medium to coarse grind is steeped in hot water for 1.5–4 min. This method makes use of the so-called French press, siphon (vacuum) coffee maker, or coffee bags, as shown in Figure 2.
The French press, patented by Attilio Calimani in 1929, is made of a cylindrical glass container provided with an internal mesh filter (Figure 2A). One tablespoon of ground coffee (about 5 g) and 4 oz (≈118.3 mL) of water at approximately 91 °C are poured to the bottom of the container. The suspension is slowly stirred and the container is closed with its lid, and filtered. After a shorter or longer steeping process depending on the preferred coffee flavor, the French press plunger is pressed down to separate the spent ground coffee from liquid brew.
The siphon coffee maker consists of two stacked glass vessels joined by a siphon chamber (Figure 2B). The ground coffee is placed in the upper chamber while the water for brewing is poured into the lower one. Upon heating, the water starts to evaporate. As the water vapors formed increase the pressure over the water-free surface, the water is forced through the siphon channel into the upper chamber, where it mixes with ground coffee. A small amount of water remaining in the bottom vessel keeps the siphon full, this allowing coffee brewing in the upper chamber. By switching off the heat source, the water vapor pressure inside the lower vessel begins to decrease and the pressure in the upper vessel combined with the gravity force pushes the brewed liquid back down to the lower chamber.
A coffee bag is like a tea bag but filled with ground coffee (Figure 3C). Coffee is brewed by steeping the bag in hot water for 3–4 min.
It is noted that vacuum pot coffee is obtained by immersing in hot water and sucked into the lower vessel through vacuum action. Moreover, the water temperature remains practically constant throughout the entire vacuum brewing process, whereas water is pre-heated before mixing with ground coffee in the above-mentioned brewing methods as well as in espresso coffee.
-
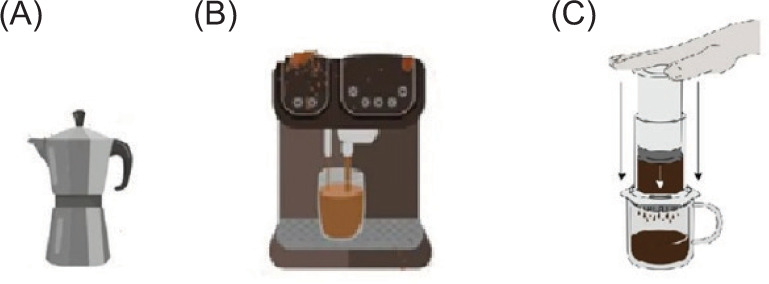
Pressure-driven coffee brewing: A small amount of pressurized hot water is forced through a bed of ground coffee of fine-medium grind pre-charged into a portafilter, which is inserted through an appropriate gasket into different devices, such as Moka pot, espresso machine, and AeroPress coffee maker (Figure 3).
The water charged in the bottom vessel of Moka pot is heated using a gas-fired or electric stove and, thanks to the portafilter’s gasket sealing, partially vaporized to make most of the water arise along the funnel tube, pass through the ground coffee bed up to be discharged in the upper vessel. On the contrary, the steam produced by the espresso machine boiler pushes hot water from the top of the machine down through the ground coffee at a very fast speed, yielding a cup of espresso coffee in just 20 s. Moka pot was invented by the Italian engineer Alfonso Bialetti in 1933, who named it after the port city of Mokha on the Red Sea coast of Yemen. Since then, this pot has become a basic coffee brewer in Italy.
The espresso machine was invented by Luigi Bezzera in the early 1900s, but its patent rights were acquired by Desiderio Pavoni in 1905, who introduced espresso to the Italian market. In 1961, the Faema Company (Binasco, Italy) made use of an electric pump to force water at a pressure of 9 bar through ground coffee. This coffee machine represented the prototype for the current espresso coffee machines (Andrews, 2022).
In the 1970s, Italian Illycaffè SpA (Trieste, Italy) developed the so-called easy-serving espresso (ESE) pod (i.e., a portion of ground coffee enveloped in a paper filter) to be directly used in espresso coffee machines.
AeroPress is a manual coffeemaker invented by Alan Adler in 2004. It consists of a plastic tube ending with a twist cap accommodating a paper filter, and a plunger with an airtight silicone seal. Once the ground coffee and hot water are sequentially added to the bottom of the tube and the mixture slowly stirred for 10 s, the plunger is inserted into the plastic tube and gently pressed by collecting liquid brew in the underneath placed cup, decanter, or coffee pot, and used for serving.
-
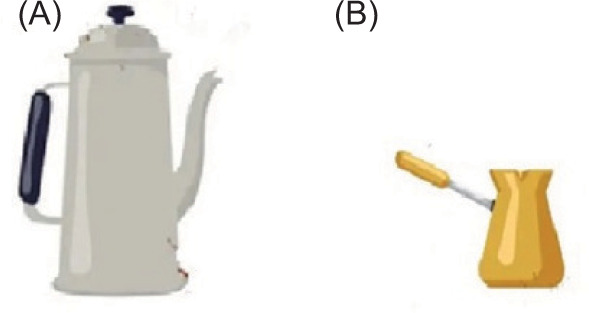
Coffee brewing using boiling water: Once water is heated up to the boiling point in a pot of different forms, ground coffee of very fine grind is added and mixed. Then, the pot is removed from the heat, and the mixture is steeped for a few minutes. As ground coffee settles to the bottom of the pot, the clear brew is served.
Figure 4 shows the main coffee makers relying on boiling water, such as the so-called cowboy or Turkish coffee makers.
-
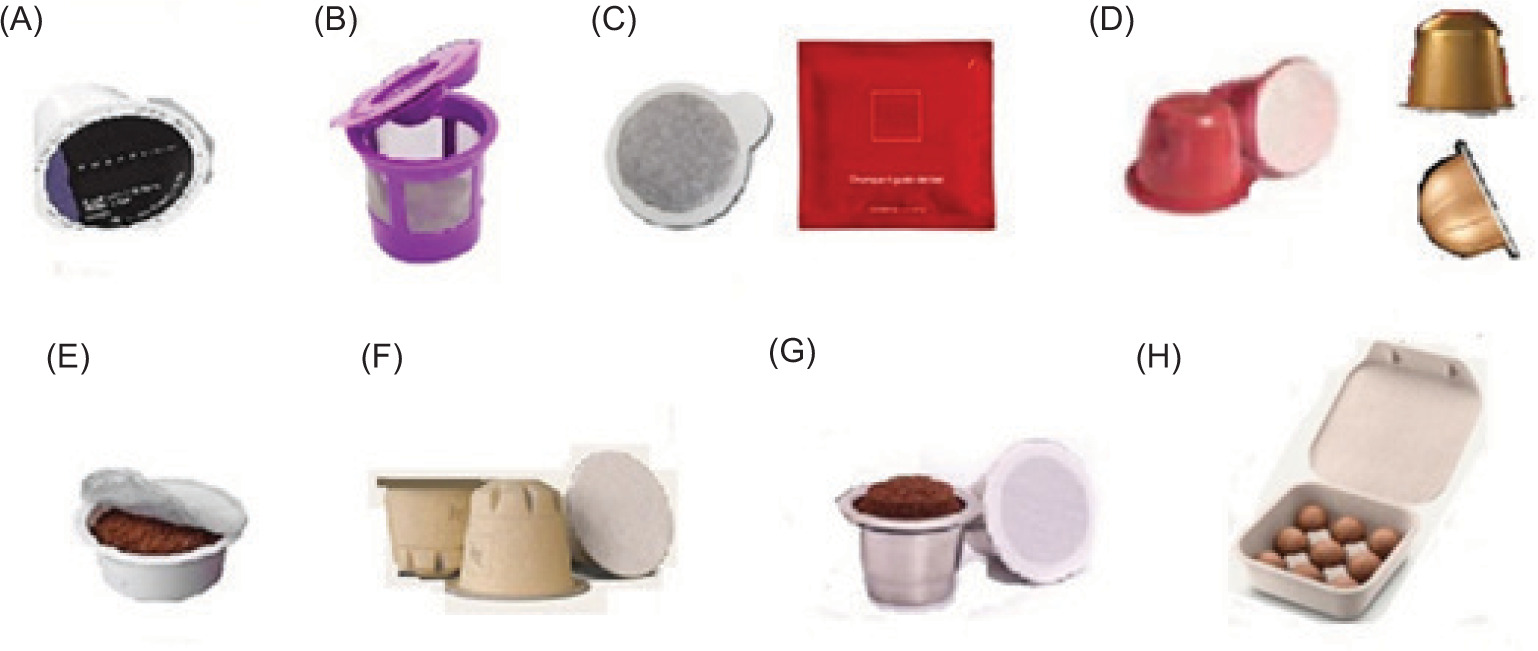
Single-serve coffee brewing: Prefixed amount of ground coffee filling single-serve containers (i.e., pods or capsules of different materials) are used in conjunction with specialized coffee machines, where the extraction water is stored at ambient temperature or kept hot at 80–90 °C to shorten the brewing period to less than 1 min. As soon as a single-serve coffee container is inserted and button pressed, the bottom of the container is pierced with a discharge nozzle, while an upper small needle allows the extraction water to be forced into the container itself to percolate through porous coffee particle bed and thus drop into the cup below. Figure 5 shows the main single-serve coffee containers currently available on the market.
Figure 1. Schematic of the main coffee brewing devices acting upon gravitational potential energy: (A) Harrio V60 filter; (B) Chemex; (C) drip coffee maker; and (D) Kalita wave device.
Figure 2. Schematic of main coffee brewing methods involving the immersion or steeping of ground coffee in hot water: (A) French press; (B) siphon (vacuum) coffee maker; and (C) coffee bags.
Figure 3. Schematic of main pressure-driven coffee brewing methods: (A) Moka pot; (B) espresso machine; and (C) AeroPress coffee maker.
Figure 4. Schematic of the main coffee brewing methods using boiling water: (A) Cowboy and (B) Turkish coffee maker.
Figure 5. Schematic of the main coffee brewing methods using single-serve coffee containers: (A) Keurig® K-cup; (B) reusable Keurig® K-cup; (C) ESE pod with a heat-sealable paper filter to be wrapped in a PE-Al-PET pouch; (D) coffee capsules made of plastics, aluminum, or bioplastics; (E) compostable coffee capsules made of polylactic acid (PLA); (F) paper pulp-based capsules; (G) rechargeable stainless steel coffee capsules with a paper filter; (H) coffee balls (CoB) (CoffeeB, Migros-Genossenschafts-Bund, Zürich, CH).
By using such single-serve systems, the brewing process is so shortened and simplified that, contrary to the conventional espresso machines, the pod or capsule coffee machines are operated without training and effort to apportion the ground coffee needed.
Although ESE coffee pods were launched in the 1970s, the single-serve coffee market practically started in 1986 as Nestlé SA (Vevey, Vaud, Switzerland) launched Nespresso® coffee capsules to be brewed in novel easy-to-use coffee machines for offices (Grant, 2020). Such a combined system was ideated by Eric Favre, a Nestlé engineer, and pre-tested by Nestlé in Switzerland, Italy, and Japan after a couple of years. This novel coffee brewing method was coldly received by the coffee market, and in 1988, it was repositioned as a luxury item for home consumers. Although in the 1990s, Nespresso® coffee pods acquired popularity in Europe, their acceptance in the United States was low, probably because of the high popularity of drip coffee maker (Figure 1C). As Favre was forced to leave Nestlé in 1991, he established a successful espresso capsule company Monodor SA (now Mocoffee, Zug, Switzerland) that improved capsule design (as in the case of incinerable capsules made from PP instead of Al with an overall weight of about 12% of the capsule itself) and coffee machine, which was equipped with an integrated filter so as to be fed with filter-free capsules. His cooperation with Luigi Lavazza SpA (Turin, Italy), Federation of Migros Cooperatives (Zurich, Switzerland), and so on helped capsule’s success, this triggering a series of legal battles with Nestlé that finally settled in 2003 (House of Switzerland, 2017). As the popularity of Nespresso® coffee capsules increased, and the patents deposited by Nestlè SA and Monodor SA started to expire around 2012, several competitor brands entered the market.
As early as 1990, Green Mountain Coffee Roasters (now trading as Keurig Dr Pepper) launched Keurig® K-cups (Figure 5A) in North America. In 1998, seven coffee roasters and machine manufacturers founded the non-profit Consortium for the Development and the Protection of the ESE Standard (https://eseconsortium.com/consorzio; accessed: 22 May 2025) to encourage wide adoption of this open design. The investment needed to adapt coffee capsules machines to coffee pods (named as “pads” in the United States, the United Kingdom, and the EU) was limited because the pressure of extraction water had to be just lowered to avoid bursting of paper filter, as in the case of coffee pad machines developed by Dēlonghi SpA (Treviso, Italy), Krups (SEB Developpement SpA, Ecully, France), and Philips SpA (Milan, Italy; Senseo® coffee maker, https://www.philips.it/c-p/HD7810_60/macchina-da-caffe-a-cialde; accessed: 22 May 2025). Thus, since 2001, several coffee makers associated with the above-mentioned consortium have launched this format, filled with about 7 g of ground coffee, whereas a capsule approximately contains 5 g of ground coffee. A coffee pod consists of two basic elements, that is, the inner capsule or cup, which is generally made of aluminum, plastic, or bioplastic, and the aluminum film to assure hermetic sealing and a barrier effect against light, humidity, and oxygen to maintain fragrance and freshness of coffee. On the contrary, coffee pads refer to prefixed doses of RGC packed in paper filters, which must be stored in protective foil pouches (Figure 5C).
The coffee market currently features approximately 400 competitor capsule brands, despite growing concerns about sustainability. With a recycling rate for spent coffee capsules below 5% (Grant, 2020), the local government in Hamburg, Germany, in 2016, banned use of coffee capsules in all government organizations and offices. In response to this ban, Nestlé Nespresso® SA (Vevey, Vaud) pursued a two-pronged approach. The company established more than 100,000 aluminum capsule recycling collection points across 70 countries (Nestlé, 2022) to boost recycling rates. Additionally, in October 2023, Nespresso® launched novel paper-based home-compostable pods (Figure 5F) in France and Switzerland, the culmination of 3 years of research and development (Ludmir, 2023). These new compostable capsules are composed of 82% paper pulp and are coated with a thin, protective compostable biopolymer film (Nestlé, 2022). This timely launch coincided with the European Commission’s drafting of new packaging regulations, which could potentially lead to the disappearance of single-use capsules, made from standard aluminum and plastics, from store shelves.
Packaging recyclability was also on the agenda of other coffee players.
The 2015-joint development process between Flo SpA (Fontanellato, Parma, Italy) and Nature Works LLC (Plymouth, MN, USA) led to GEA (by Flo SpA) compostable PLA coffee capsules in 2018 (Figure 5E), which were compatible with the Lavazza A Modo Mio system (Sustainable Plastics, 2020). Similarly, in 2021, the NEXE Innovations Inc. (Surrey, Canada) introduced novel 100% compostable, plant-based pods compatible with Keurig® single-serve brewing systems (Guglani, 2021).
As the latest attempt at easing the disposables of spent coffee pods in organic waste bins, it is worth citing novel coffee balls (CoffeeB) launched by Migros-Genossenschafts-Bund (Zürich, CH) in 2022 (Figure 5H). Each coffee ball containing 5.3–5.9 g of ground and roasted coffee is coated with a thin protective biopolymer film to retain coffee aroma. In this way, by avoiding the generation of any aluminum or plastic capsule waste, spent coffee balls are easily recycled by composting under both home and industrial conditions (https://www.migros.ch/it/content/coffeeb; accessed: 22 May 2025).
Such a final goal could be achieved by using reusable Keurig® K-cups (Figure 5B) or rechargeable stainless steel coffee capsules (Figure 5G). At the expense of a lower service degree related to the need of dosing ground coffee in each reusable cup, disposing of SCGs and cleaning the cup before its reuse would avoid any consumption of aluminum or plastic packaging material and associated waste disposal, and would make easier the disposal of SCGs in domestic organic waste bins. A simplified rechargeable system for stainless steel coffee capsules was also developed by a French brand CAPS’ME (https://www.capsme.fr/products/3-capsules-reutilisables-inox; accessed: 22 May 2025).
Energy consumption during coffee brewing
Each of the described coffee brewing systems exhibits distinct energy consumption characteristics. These yields vary depending on the factors such as the volume of coffee brewed and the system’s operational duration, including its stand-by state.
When using a Moka pot, gas or electricity consumption can be determined as suggested by the Product Category Rules for Moka coffee preparation (EPD, 2019a). First, measure the volume of water added to Moka pot. Then, weigh Moka funnel (either empty or after its basket has been filled with ground coffee) with an analytical balance. Next, place the funnel in the boiler, assemble it into the coffee collecting chamber, and position Moka pot over an induction or gas-fired stove. After adjusting the stove to supply a power of 0.6 kW, turn on the heat until the coffee stops flowing from the spout, noting the coffee end time and energy consumed. Subsequently, measure the overall volume of coffee recovered (Vc), along with the remaining mass of water in the boiler and SCG in the funnel, which are recovered as soon as Moka pot cools and is disassembled. Energy consumption by an electric hob can be monitored via a digital power meter, while that by a gas-fired stove can be estimated by multiplying the volume of gas consumed by its corresponding lower heating value (LHV [kJ L–1]).
When using any espresso or single-serve coffee machine, energy consumption is determined according to standard EN 60661 (European Committee for Electrotechnical Standardization [CENELEC], 2014) and the Product Category Rules for espresso coffee preparation (EPD, 2019b). This involves performing five sequential brewing cycles over a period of 100 min. First, weigh the filter holder (either empty or filled with ground coffee) or the coffee pod/capsule. Then, switch on the coffee machine and continuously monitor its energy consumption from start of the brewing process using a power meter. The first brewing cycle begins 1 min after the machine is ready; record the start time and initial energy consumed. At the end of brewing, measure the volume of the coffee collected in a cup, along with the mass of machine’s filter holder and exhausted pod/capsule to assess the amount of SCG. The second brewing cycle starts 1 min after completion of the first cycle, registering the initial time and energy consumed. Each cycle produces two 40-mL cups of coffee, either in parallel (for espresso machines) or in sequence (for pod/capsule machines), repeating post-brewing measurements (volume and SCG). Energy consumption is continuously monitored for 30 min, reactivating the machine if needed, and registering the total time and energy consumed. The third brewing cycle is then performed by following the same steps as that of the second cycle. Finally, energy consumption is continuously monitored for 100 min, reactivating the machine as necessary, and recording the final time and total energy consumed. The electricity consumed to brew a single 40-mL cup of coffee is then estimated as the overall energy consumed over the 100-min test divided by the number of coffee cups prepared (i.e., five cups of coffee).
The research conducted by Cibelli et al. (2021) investigated various coffee brewing parameters across different coffee makers. Their study aimed to quantify the following:
-
Amount of ground coffee used in each brewing cycle (mGC) and moisture content (xWGC) of ground coffee used per brewing cycle.
-
Number of coffee cups brewed (ncc) and the overall volume (Vc) of coffee prepared.
-
Amount of SCGs (mSCG) and moisture content (xWSGC) of SCG.
-
Specific energy consumed per single coffee cup (Ecc [Wh/cup]).
-
Coffee cup preparation time (tc [s]).
Key findings of their replicated brewing tests are summarized in Table 2, where statistically significant differences observed across various parameters are indicated by superscript lowercase letters based on the Tukey test.
Table 2. Main results with their statistical significance of three replicated coffee brewing tests carried out by Cibelli et al. (2021) using different coffee formats and makers.
| Coffee maker | mGC/cycle(g) | xWGC(% w/w) | ncc(–) | Vc(mL) | mSCG(g) | xWSCG(% w/w) | Ecc(Wh/cup) | tc(s) |
|---|---|---|---|---|---|---|---|---|
| Induction Moka pot | 16.01±0.01 | 0.68±0.12a | 3 | 119±1a | 32.8±0.5a | 61.0±0.1a | 6.8±0.2 | 88±2 |
| LPG-heated Moka pot | 16.01±0.01 | 0.68±0.12a | 3 | 118±1a | 34.1±2.3a | 60.6±0.3a | 18.3±1.2 | 62±1 |
| Espresso coffee machine | 9.00±0.03 | 0.68±0.12a | 5 | 200±2b | 19.6±0.5b* | 62.6±1.3a | 15.9±0.4 | 19±3 |
| Pod coffee machine | 7.23±0.02 | 0.56±0.21a | 5 | 200±2b | 13.7±0.8c | 56.6±2.9a,b | 12.0±0.6 | 30±5 |
| Capsule coffee machine | 5.75±0.07 | 0.54±0.22a | 5 | 200±2b | 14.0±0.5c | 62.6±1.3a | 8.5±0.2 | 25±4 |
Notes: mGC: amount of ground coffee used in each brewing cycle; xWGC: moisture content of ground coffee used in each brewing cycle; ncc: number of coffee cups brewed; Vc: the overall volume of coffee prepared; mSCG: amount of spent ground coffee; xWSGC: moisture content of spent ground coffee; Ecc: specific energy consumed per single coffee cup; tc: coffee cup preparation time; LPG: liquefied petroleum gas.
*It includes paper filter.
Different lowercase superscript letters indicate statistically significant difference among the column mean values of each parameter at p = 0.05, based on Tukey test.
For induction- and LPG-heated Moka pots, approximately 16 g of ground coffee was used per cycle, which aligned with 14–19-g range recommended by the Moka coffee disciplinary (Comitato Italiano del Caffè, 2020) for 3-cup Moka pot.
When considering the coffee dose per single cup, the amount in coffee pods (7.23 g) and espresso filters (9.00 g) was in 7–9-g range recommended by the Espresso coffee disciplinary (Comitato Italiano del Caffè, 2018), while the amount RCG in coffee capsules (5.75 g) was notably lower.
The moisture content of ground coffee (xWGC) was remarkably consistent across all formats, averaging about 0.62% w/w, indicating that the format did not significantly influence this parameter.
The amount (mSCG) of SCG approximately doubled the initial amount of coffee powder used. For example, Moka pots starting with about 16 g of coffee produced approximately 33–34 g of SCGs. The moisture content of SCGs varied slightly, ranging from 56.6% to 62.6% (w/w), with no clear trend tied with the type of coffee maker.
Energy consumption per cup showed significant differences. The LPG-heated Moka pot had the highest energy consumption at 18.3 Wh/cup, followed by the espresso coffee machine at 15.9 Wh/cup. In contrast, the induction Moka pot proved considerably more energy-efficient, using energy only 6.8 Wh/cup, underscoring the benefits of induction heating. Capsule and pod coffee machines also demonstrated relatively low energy consumption at 8.5 Wh/cup and 12.0 Wh/cup, respectively.
Coffee cup preparation time (tc) also showed wide differences. Moka pots had the longest preparation time, with induction and LPG-heated versions taking 88 s and 62 s, respectively, for three cups of coffee. The espresso coffee machine offered the fastest preparation at just 19 s, while capsule and pod machines also provided quick brewing time at 25 s and 30 s, respectively.
Further insights into energy consumption arrived from other studies. Brommer et al. (2011) reported that efficient pod or capsule machines with auto power-down function consumed approximately 39 Wh per 125-mL cup (~0.31 Wh/mL). Comparing this to the Ecc data shown in Table 2, this value was lower than that of the LPG-heated Moka pot (0.46 Wh/mL) and espresso coffee machine (0.40 Wh/mL) in Cibelli et al.’s (2021) study. It was practically coincident with the pod coffee machine (0.30 Wh/mL) but higher than the capsule coffee maker (0.21 Wh/mL) and induction Moka pot (0.17 Wh/mL). Brommer et al. (2011) also noted that inefficient appliances without auto power-down functions could significantly increase energy expenditure by up to 0.87 Wh/mL.
Other studies support these variations: Phrommarat (2019) reported a higher specific energy consumption of 0.93 Wh/mL for an electric Moka pot, while energy consumption in different capsule coffee makers ranged from 0.20 Wh/mL (Phrommarat, 2019) to 0.28 Wh/mL (Humbert et al., 2009) and 0.32 Wh/mL (Dubois et al., 2011). Notably, the energy consumed per single cup for induction Moka pot (6.8 Wh/cup) was found to be significantly lower than all single-serving coffee makers examined at a 95% confidence level (95% CL), highlighting its superior energy efficiency.
Environmental impact of green coffee production
Coffee cultivation’s environmental impact has been a focus of extensive research, revealing significant issues such as deforestation, biodiversity loss, habitat fragmentation, and pollution from wastewater and processing residues (Phrommarat, 2019).
Several LCAs have produced widely varying estimations of carbon footprint of coffee production, with values ranging from 3.7 kg to 15.8 kg carbon dioxide equivalent (CO2e)/kg of GCB (Arzoumanidis et al., 2017; Coltro et al., 2006; Domínguez-Patiño et al., 2014; Humbert et al., 2009; Killian et al., 2013; PCF Pilotprojekt Deutschland, 2008). For instance, PCF Pilotprojekt Deutschland (2008) attributed 55% of carbon footprint to cultivation and on-farm processing, and 30% carbon footprint to consumption, while Humbert et al. (2009) similarly found that about half of the total environmental impact originated from the processes (such as cultivation, treatment, processing, packaging, and distribution) controlled by coffee producers and suppliers, with the rest attributed to consumers (use and post-consumer disposal).
Key findings of the recent studies are as follows:
-
Brazilian coffee production: Coltro et al. (2006) highlighted substantial water, energy, and fertilizer inputs required for Brazilian coffee bean production.
-
Central American Arabica carbon footprint: Arellano and Hernández (2023) reviewed Arabica coffee production in Central America, identifying application of nitrogen fertilizer as the primary emission factor, particularly in intensified unshaded plantations. The authors found that traditional polycultures had a lower carbon footprint (0.51 kg CO2e/kg cherry coffee) and higher carbon storage (53.6 MT/ha), compared to unshaded monocultures (0.64 kg CO2e/kg and 9.7 MT/ha, respectively). Shade trees are crucial for carbon conservation, with agroecosystems retaining about 28% of tropical forest’s aboveground biomass carbon, while unshaded monocultures lost 95%.
-
Vietnam coffee carbon footprint: Nab and Maslin (2020) estimated the carbon footprint of conventional Arabica coffee production in Vietnam as 15.3 kg CO2e/kg of green coffee. However, the authors found that sustainable coffee production significantly reduced this by 77%, to 3.5 kg CO2e/kg, this being primarily attributed to decreased agrochemical inputs and exportation of coffee beans via cargo ship rather than freight flight.
-
Indonesian coffee sustainability: Rahmah et al. (2022) assessed Indonesian coffee systems, finding that organic fertilizing systems (OFS) offered superior environmental and economic benefits. In contrast, chemical fertilizing systems (CFS) had the highest environmental impact, lowest economic returns, and the highest energy consumption. While OFS increased energy use, chemical organic systems presented a viable energy-efficient alternative. The study identified fertilizer (especially NPK) and rice husk as key environmental hotspots.
Researchers consistently recommend several strategies to mitigate these impacts:
-
Optimizing nitrogen application
-
Using low nitrification/denitrification potential fertilizers
-
Exploring mycorrhizal fungi or nitrogen-fixing bacteria
-
Incorporating functional trees (shade and/or nitrogen fixers)
-
Implementing soil conservation practices
-
Utilizing biofertilizers
Implementing these recommendations through proper certification schemes could lead to even greater environmental benefits required for coffee cultivation.
Based on the production of various GCB varieties (Arabica and Robusta) at the farm gate (FG), cultivated in different countries under diverse agricultural conditions (see Table 1), Table 3 presents 16 environmental impact categories of the PEF standard method (European Commission, 2021) estimated using the LCA SimaPro Craft 10.2.0.0 software.
Table 3. Environmental profile for 1 kg of green Arabica or Robusta coffee beans at farm gate.
| Coffee variety | Arabica | Arabica | Arabica | Arabica | Robusta | Robusta | Robusta | Robusta | |
|---|---|---|---|---|---|---|---|---|---|
| Country | BR | CO | HR | IN | VN | IN | ID | BR | |
| IC | Unit | ||||||||
| CC | kg CO2e | 4.91 | 6.56 | 10.20 | 17.7 | 6.64 | 8.40 | 18.1 | 2.79 |
| OD | kg CFC11e | 3.6×10⁻⁷ | 3.1×10⁻⁷ | 6.6×10⁻⁸ | 1.7×10⁻⁷ | 3.2×10⁻⁸ | 7.5×10⁻⁸ | 8.1×10⁻⁸ | 2.6×10⁻⁸ |
| IR | kBq Ue235 | 1.6×10⁻¹ | 1.3×10⁻¹ | 7.8×10⁻² | 2.2×10⁻¹ | 4.6×10⁻² | 9.3×10⁻² | 1.1×10⁻¹ | 3.2×10⁻² |
| PhOF | kg NMVOCe | 2.8×10⁻² | 4.1×10⁻² | 3.6×10⁻² | 9.9×10⁻² | 2.1×10⁻² | 4.6×10⁻² | 5.6×10⁻² | 1.4×10⁻² |
| PM | Disease inc. | 7.75×10⁻⁷ | 9.4×10⁻⁷ | 1.8×10⁻⁶ | 6.3×10⁻⁶ | 4.6×10⁻⁷ | 2.9×10⁻⁶ | 3.0×10⁻⁶ | 3.6×10⁻⁷ |
| AC | mol He+ | 1.0×10⁻¹ | 1.3×10⁻¹ | 2.2×10⁻¹ | 9.0×10⁻¹ | 4.5×10⁻² | 4.2×10⁻¹ | 3.8×10⁻¹ | 4.5×10⁻² |
| FWE | kg Pe | 1.7×10⁻³ | 3.2×10⁻³ | 1.8×10⁻³ | 3.7×10⁻³ | 8.6×10⁻⁴ | 1.7×10⁻³ | 2.9×10⁻³ | 8.3×10⁻⁴ |
| ME | kg Ne | 3.5×10⁻² | 1.7×10⁻¹ | 1.1×10⁻¹ | 1.7×10⁻¹ | 3.1×10⁻² | 7.8×10⁻² | 1.9×10⁻¹ | 1.8×10⁻² |
| TE | mol Ne | 0.41 | 0.54 | 0.96 | 4.0 | 0.19 | 1.87 | 1.67 | 0.18 |
| FWET | CTUe | 840 | 599 | 311 | 489 | 180 | 230 | 418 | 127 |
| C-HT | CTUh | 1.9×10⁻⁸ | 3.8×10⁻⁸ | 2.4×10⁻⁸ | 4.8×10⁻⁸ | 1.6×10⁻⁸ | 2.2×10⁻⁸ | 4.2×10⁻⁸ | 8.0×10⁻⁹ |
| NC-HT | CTUh | 4.9×10⁻⁷ | 2.6×10⁻⁷ | 3.4×10⁻⁷ | 1.9×10⁻⁶ | 5.1×10⁻⁷ | 8.7×10⁻⁷ | 1.8×10⁻⁶ | 4.7×10⁻⁷ |
| LU | Pt | 442 | 1160 | 592 | 961 | 305 | 416 | 742 | 157 |
| WU | m3depriv. | 2.96 | 2.14 | 2.47 | 20.8 | 12.7 | 8.29 | 4.72 | 0.63 |
| RUF | MJ | 41.9 | 51.6 | 38.4 | 127 | 22.0 | 57.6 | 60.0 | 18.7 |
| RUMM | kg Sbe | 8.6×10⁻⁵ | 6.3×10⁻⁵ | 2.5×10⁻⁵ | 9.9×10⁻⁵ | 2.4×10⁻⁵ | 4.4×10⁻⁵ | 4.7×10⁻⁵ | 1.6×10⁻⁵ |
Notes: Product environmental footprint (PEF) method’s 16 impact categories (IC) for selected growing regions (Brazil, BR; Colombia, CO; Honduras, HR; India, IN; Indonesia, ID; and Vietnam, VN). AC: acidification (mol H+e); CC: climate change (kg CO2e); CFC11e): trichlorofluoromethane (expressed as equivalent); C-HT: human toxicity, cancer (CTUe); CTUe: Comparative Toxic Unit for freshwater ecosystems (expressed as equivalent); CTUh: Comparative Toxic Unit for human (expressed as equivalent); FWE: freshwater eutrophication [kg Pe]; FWET: ecotoxicity, freshwater [CTUe]; IR: ionizing radiation [kBq235Ue]; LU: land use [Pt]; ME: marine eutrophication [kg Ne]; NC-HT: human toxicity, non-cancer (CTUe); NMVOCe: non-methane volatile organic compounds (expressed as equivalent); OD: ozone depletion (kg CFC11e); PhOF: photochemical ozone formation (kg NMVOCe); PM: particulate matter (disease inc.); RUF: resource use fossils [MJ]; RUMM: resource use minerals and metals [kg Sbe]; TE: terrestrial eutrophication (mol Ne); and WU: water use (m3 deprived).
Environmental impact data for GCBs, as observed in Table 3, revealed considerable diversity based on coffee variety (Arabica and Robusta) and the country of origin (Brazil, Vietnam, India, Indonesia, Colombia, and Honduras). Generally, Arabica coffee exhibits a higher PEF across various categories, compared to Robusta.
For climate change (CC [kg CO2e]) impacts, Arabica typically has higher scores, reaching approximately 18 kg CO2e/kg in India, while Brazil’s Robusta stands out for its very low emissions of 2.8 kg CO2e/kg. In terms of ozone depletion (OD [kg CFC11e]), while overall potential is relatively low, it can vary up to 14-fold, with Brazil showing both extremes depending on the variety. Arabica coffee also generally shows a higher impact than Robusta for ionizing radiation, photochemical ozone formation (PhOF [kg NMVOCe]), and particulate matter (PM) formation, particularly in case of India, whereas Brazil’s Robusta consistently presents the lowest impact in these fields.
Eutrophication and acidification (AC) are significant environmental impacts of coffee production, stemming from excessive nutrient and acid deposition across freshwater, marine, and terrestrial ecosystems. Across all categories for both impacts, Arabica coffee consistently demonstrates a higher potential than Robusta. For eutrophication, Brazil generally represents the lowest impact source, while India and Southeast Asian origins (specifically Indonesia for marine eutrophication) tend to have the highest values. Similarly, Arabica is considerably more acidifying, with Arabica from India showing the highest acidification potential (0.90 mol He+), a more than 20-fold difference compared to Robusta in Brazil (0.045 mol He+). These trends indicate that cultivation practices, including fertilizer use and runoff management, associated with different coffee varieties and regions, significantly influence their PEF regarding nutrient pollution and acidification.
Regarding toxicity, Arabica from Brazil shows an unusually high impact for freshwater ecotoxicity (840 CTUe), significantly exceeding Robusta from the same region (127 CTUe), suggesting that local agrochemical use could be a factor.
For human toxicity, both cancer (C-HT)- and non-cancer (NC-HT)-related impacts are generally higher for Arabica, compared to Robusta. While the cancer toxicity footprint is minor, it is not negligible, with Robusta consistently showing lower values (e.g., Robusta in Brazil at 8.0×10⁻⁹ CTUh, compared to Arabica in India at 4.8×10⁻⁸ CTUh). Arabica demonstrates higher non-cancer toxicity (e.g., Arabica in India at 1.90×10⁻⁶ CTUh, compared to Robusta in Brazil at 4.7×10⁻⁷ CTUh), indicating a more pronounced human toxicity footprint for Arabica cultivation in these regions.
Land use requirements are considerably higher for Arabica coffee, with Arabica from Colombia exhibiting the highest land use impact (1,160 Pt) and Robusta from Brazil the lowest (157 Pt), highlighting differing cultivation needs and efficiency.
Water use efficiency also varies significantly, with Brazil’s Robusta being vastly more efficient; Arabica from India shows the highest water consumption (20.8 m3 deprived), contrasting sharply with Robusta from Brazil (0.63 m3 deprived).
Fossil resource consumption is notably higher for Arabica, with Arabica from India demanding more than six times more fossil energy (127 MJ), compared to Robusta from Brazil (18.7 MJ). Similarly, Arabica from India also has the highest mineral and metal resource intensity (9.9×10⁻⁵ kg Sbe), making it the most resource-intensive in this category, while Robusta from Brazil again demonstrates the lowest impact (1.6×10⁻⁵ kg Sbe).
After normalizing impact category scores and weighing them to reflect their perceived importance, the overall PEF score, expressed in micro-points per kilogram (µPt/kg), represents the combined environmental impact across all categories. As shown in Table 4, Arabica coffee consistently demonstrates a higher PEF across almost all categories, compared to Robusta, with India (Arabica) showing the highest impacts and Brazil (Robusta) consistently presenting the lowest, making Robusta from Brazil the most environment-sustainable choice.
Table 4. Sustainability ranking of 1 kg of green Arabica and Robusta coffee beans at farm gate for a few selected growing regions according to the overall PEF score.
| Rank | Coffee variety and origin | Overall environmental impact | PEF (μPt/kg) | |
|---|---|---|---|---|
| 1 | Robusta | Brazil | Lowest impact across almost all categories | 459 |
| 2 | Robusta | Vietnam | Low land, toxicity, and water impact | 764 |
| 3 | Arabica | Brazil | Balanced, moderate impact overall | 1,167 |
| 4 | Arabica | Colombia | High land and ecotoxicity burden | 1,495 |
| 5 | Arabica | Honduras | Moderate impact, especially water and land | 1,575 |
| 6 | Robusta | India | Higher ionizing radiation and eutrophication | 2,196 |
| 7 | Robusta | Indonesia | High in almost all environmental categories | 2,828 |
| 8 | Arabica | India | Highest impact across nearly all categories | 4,744 |
Notes: PEF: product environmental footprint.
Environmental impact of coffee consumption
The environmental impacts of coffee consumption account for a significant portion of the total environmental impact, ranging from 30% to 50% (Humbert et al., 2009; PCF Pilotprojekt Deutschland, 2008), with these figures depending on specific coffee preparation methods and types used (Büsser and Jungbluth, 2009).
Concerning the coffee preparation methods used commonly, in Italy Moka pot is the predominant method for preparing coffee at home, typically using ground coffee. Globally, a diverse array of coffee machines exists apart from Moka pot (see Section 2.5). The country-wise market share of these brewers varies significantly. For instance, electric drip-filter coffee machines maintained a market share of 55% in the United States (Kraeutler et al., 2015) and 62% in Germany (Brommer et al., 2011). In these drip brewers, the brewed coffee is stored in a continuously heated reservoir. A notable drawback of many of these machines is their energy inefficiency, as they often lack auto-power down features, leading to up to three-fourths of their total electricity consumption occurring in a standby mode to keep the beverage hot (Bush et al., 2009). In contrast, single-serve coffee makers are designed to force a precise volume of hot water through pre-packaged coffee dispensers, such as pods and capsules. These machines compress and heat water to a pressure ranging from 3 bar to 19 bar and temperature ranging from 93 °C to 95 °C, with power consumption typically ranging from 400 W to 1,500 W.
Brommer et al. (2011) estimated the business-to-consumer GHG emissions associated with the preparation of 2,000 cups of coffee (125 mL each), these being averagely consumed in German families on a year basis. The agriculture phase was responsible for 55.4% of the overall GHG emissions, followed by the consumer and post-consumer phases (36%), coffee roasting, packaging, and distribution (6.6%), and overseas transportation (1.9%).
Hassard et al. (2014) assessed the carbon footprint and energy consumption of different coffee products in Japan, showing that most GHGs were released from coffee cultivation and production, while processing and preparation involved higher consumption of energy.
Hicks (2017) conducted a comparative LCA in the United States, concluding that coffee pods were the most environment-friendly option between drip filter, French press, and pod coffee machines.
An LCA commissioned to Quantis-Canada by the Packaging Consortium concluded that an 8-oz (236.6 mL) cup of coffee prepared using single-serve coffee systems exhibited a superior environmental performance compared to drip-brewed systems in North America (Chayer and Kicak, 2015). This was primarily attributed to the accurate dosage of ground coffee (reducing waste) and the potential for energy-saving machines with longer service lifespan. The authors found that reduction in ground coffee and electricity consumption offset the increased packaging waste generated by single-serve systems.
Phrommarat (2019), conducting a cradle-to-grave assessment of organically farmed Arabica coffee in Thailand, found Moka pot (heated on an electric plate) to be particularly energy-intensive. This energy demand led to damage of non-renewable resources directly related to the consumption of electricity from fossil sources and to human health. This conclusion strongly suggests that, within the context of Thailand’s electricity grid at the time of the study, which probably relied significantly on fossil fuels, the Moka pot’s energy consumption translated directly into substantial environmental burdens. The high proportion of nonrenewable sources in the electricity mix would amplify the impact of any energy-intensive appliance.
Conversely, Cibelli et al. (2021), in a study on Italian coffee consumption, specifically assessed the carbon footprint of a 40-mL cup prepared in a three-cup Moka pot heated by either an induction- or a gas-fired stove. They reported emissions of 45–57-g CO2e and 47–59-g CO2e per cup, respectively. Crucially, their comparison to single-serve machines (espresso, pod, and capsule) showed that preparing coffee with a pod or capsule machine resulted in extra emissions of 12.6–27.6-g CO2e, compared to an induction Moka pot. This finding implies that, within the Italian energy context, Moka pot, particularly when using electricity (induction) from a grid that has a more favorable mix of renewable and nonrenewable sources, compared to Thailand, or gas, presents a relatively lower carbon-emitting option, compared to the combined impact of single-serve systems (including their packaging).
While both Cibelli et al. (2021) and Phrommarat (2019) assessed the environmental impact of coffee preparation using a Moka pot, their conclusions, although apparently divergent, are largely influenced by the distinct energy mixes of their respective study regions—Thailand and Italy. The differing conclusions highlight that the environmental performance of an appliance is not solely inherent to the appliance itself but is significantly shaped by the energy infrastructure of the region where it is used. In case electricity grids rely heavily on fossil fuels, any energy-intensive brewing method naturally shows a higher environmental burden related to resource depletion and emissions. Conversely, in regions with a cleaner energy mix, the same appliance could appear more favorable, especially compared to the alternatives that carry additional burdens of packaging or other life cycle stages.
A recent report conducted by Eneroth et al. (2022), intended for Swedish consumers, detailed the environmental impacts of coffee, tea, and cocoa, specifically quantifying climate impact, land use, biodiversity, and water use. For coffee, the climate impact of roasted ground coffee on the Swedish market was 4.0 kg CO2e/kg powder, while instant coffee powder had a higher impact at 11.5 kg CO2e/kg. When considering prepared beverages, the total climate impact per liter, including energy for brewing, was estimated at 0.25 kg CO2e for brewed coffee and 0.16 kg CO2e for instant coffee. Notably, less GCBs are needed to produce the same amount of ready-to-drink instant coffee, compared to brewed coffee. Instant black coffee per cup registered 24-g CO2e, and brewed black coffee showed 38-g CO2e. The report highlighted that adding milk to coffee substantially increases its climate impact. Although the existing literature often attributes a significant portion of coffee’s total climate impact to the consumer stage due to machine’s electricity use, Eneroth et al. (2022) observed that with the Nordic region’s low-carbon energy mix, contributions from brewing and heating water and milk were minor. Another crucial factor at the consumer stage is the waste of prepared coffee; this wastage contributes to climate impact through additional production costs and electricity consumed in preparation, although the latter’s contribution was calculated as small. The report concluded that household coffee waste is substantial and reducing it could significantly decrease the environmental impact of Swedish hot drink consumption.
It is important to note that direct comparisons across various coffee LCA studies are often challenging because of significant differences in methodologies. These disparities include variations in coffee varieties (e.g., Arabica vs. Robusta), farming practices (conventional and organic), cultivation locations, beverage volumes (ranging from 40 mL to 237 mL), and brewing methods (using roasted coffee beans, ground coffee, or coffee packed in pods and capsules made from different materials). Furthermore, the specific coffee brewing method adopted by the consumer and the energy efficiency of the used appliance have a considerable effect on the environmental impact of the use phase.
Environmental impact of coffee packaging
Early research done by De Monte et al. (2005) established foundational insights into the environmental impact of various coffee packaging formats through an LCA. Their study compared metallic cans, glass jars, and poly-laminated bags, analyzing the entire life cycle from raw material extraction to disposal. While poly-laminated bags offered a lighter alternative for small packages, their poor recyclability meant that metallic cans and glass jars were generally preferred in case material recycling was prioritized due to their established infrastructure and higher recovery proportions. Lighter weight and lower transport emissions of poly-laminated bags were often offset by a higher environmental impact at the end-of-life stage because of the inherent difficulty in recycling multi-layered materials.
Continuing this line of inquiry, Heller’s (2017) report further synthesized findings from various LCA studies on coffee consumption. Heller identified packaging as a critical contributor to coffee’s overall PEF, particularly during the consumer use phase. His analysis highlighted that the following:
-
Single-serve coffee formats (e.g., pods/capsules) generally have a higher environmental impact per serving than bulk or traditionally brewed coffee. This is primarily due to the material and energy-intensive production of the capsules, which are often made from mixed materials (plastic, aluminum, etc.), difficult to recycle.
-
The material weight and type of packaging are substantial drivers of environmental impact. While coffee cultivation accounts for a large portion of the overall footprint, packaging, especially for smaller portion sizes, can disproportionately contribute to the issues such as resource depletion, waste generation, and climate change per cup.
-
Studies indicate that the environmental burden from packaging, particularly for single-serve systems, often exceeds the impacts of the disposal of traditional ground coffee, even when considering brewing energy. The energy consumed by some single-serve machines can also be higher compared to conventional brewing methods.
-
The end-of-life management of packaging is a major factor. If single-serve capsules are not effectively recycled (often because of material complexity or lack of accessible infrastructure), their environmental impact from landfilling or incineration increases significantly.
-
Conversely, bulk coffee or coffee sold in larger and more easily recyclable packaging (e.g., recyclable bags or tins for ground/whole beans) tends to have a lower PEF associated with packaging per serving. The reusability of brewing equipment for traditional coffee further reduces the overall impact.
Heller’s (2017) report concluded that while cultivation and on-farm processing are significant hotspots for coffee, packaging formats, especially single-serve capsules, impose a disproportionately high environmental burden per serving, compared to traditional coffee formats. This is primarily due to material intensity, recycling difficulties, and associated energy consumption.
More recently, Marinello et al. (2021) provided a comprehensive review specifically on the environmental impacts of coffee capsules, focusing on recovery and management techniques. This review corroborated and expanded upon Heller’s (2017) findings regarding the challenges of complex capsule materials.
Marinello et al. (2021) highlighted significant difficulties with polylaminate materials (e.g., plastics and aluminum foil) commonly found in popular coffee capsules. Their multi-layered composition makes them difficult to manage and recycle through traditional methods. In contrast, the review noted encouraging aspects in the recovery of single-material plastics (such as PP) and metals (such as aluminum), as capsules predominantly made from these materials offer better potential for recycling than multi-layered polylaminates.
Although Marinello et al. (2021) did not provide a quantified ranking from a single primary LCA study, they synthesized insights from various studies to infer an environmental impact ranking for coffee capsules:
-
Capsules made from single and more easily recyclable materials (e.g., aluminum or specific plastics, such as PP) generally present a lower environmental impact. This is particularly true for waste management and resource depletion, assuming effective recycling infrastructure and strong consumer participation. However, challenges often arise due to their small size, residual ground coffee, and consumer confusion regarding recycling protocols.
-
Conversely, capsules made from complex polylaminates tend to have a higher environmental impact. This is primarily due to the difficulty in managing and recycling them. Their multi-layered composition hinders material separation for recycling, frequently leading to incineration or landfilling, which contributes to increased waste generation and resource depletion. Currently, recovery techniques for these materials are often inefficient or even nonexistent for widespread implementation.
Overall, Marinello et al. (2021) emphasized that, despite the growth fueled by coffee capsule convenience, the environmental consequences, especially regarding packaging waste management, remain a critical area for ongoing research and improvement in recovery techniques. The “encouraging aspects” mentioned specifically refer to the development of methods for recovering materials, indicating that the current widespread disposal of capsules (especially polylaminates) poses a major environmental concern.
These studies collectively underscore that while coffee cultivation is a primary environmental consideration, packaging, particularly single-serve formats and multi-layered materials, contributes disproportionately to the overall environmental burden at the consumer use phase. Strategies to reduce coffee’s PEF should, therefore, strongly consider shifts toward more sustainable packaging solutions and promote traditional brewing methods to mitigate impacts from the consumer use phase.
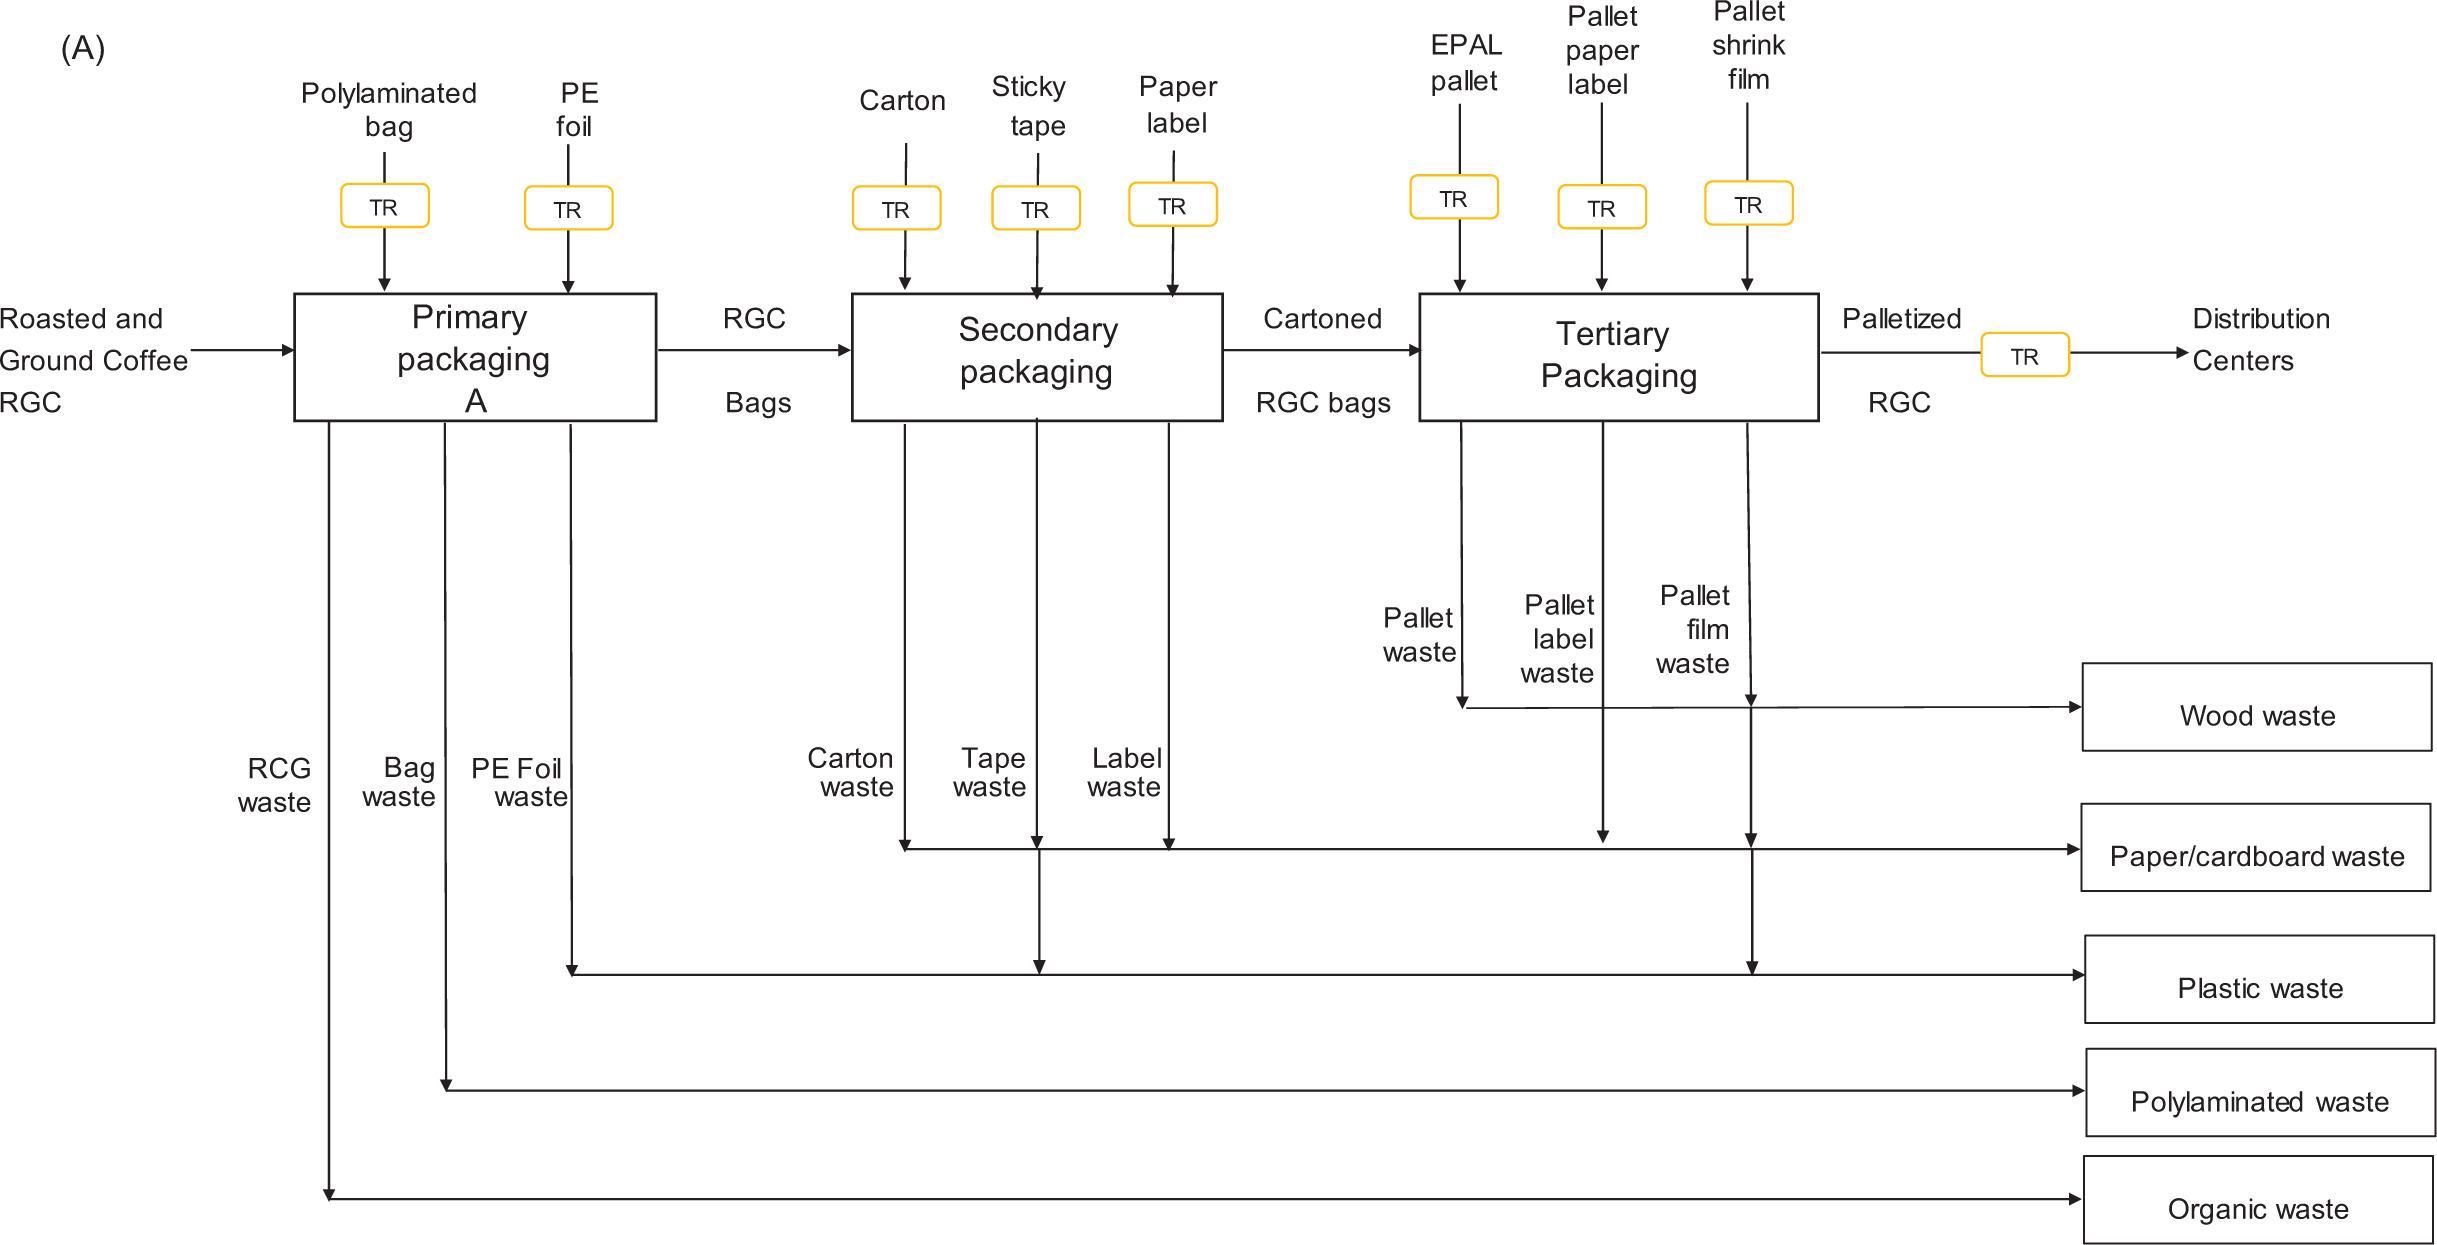
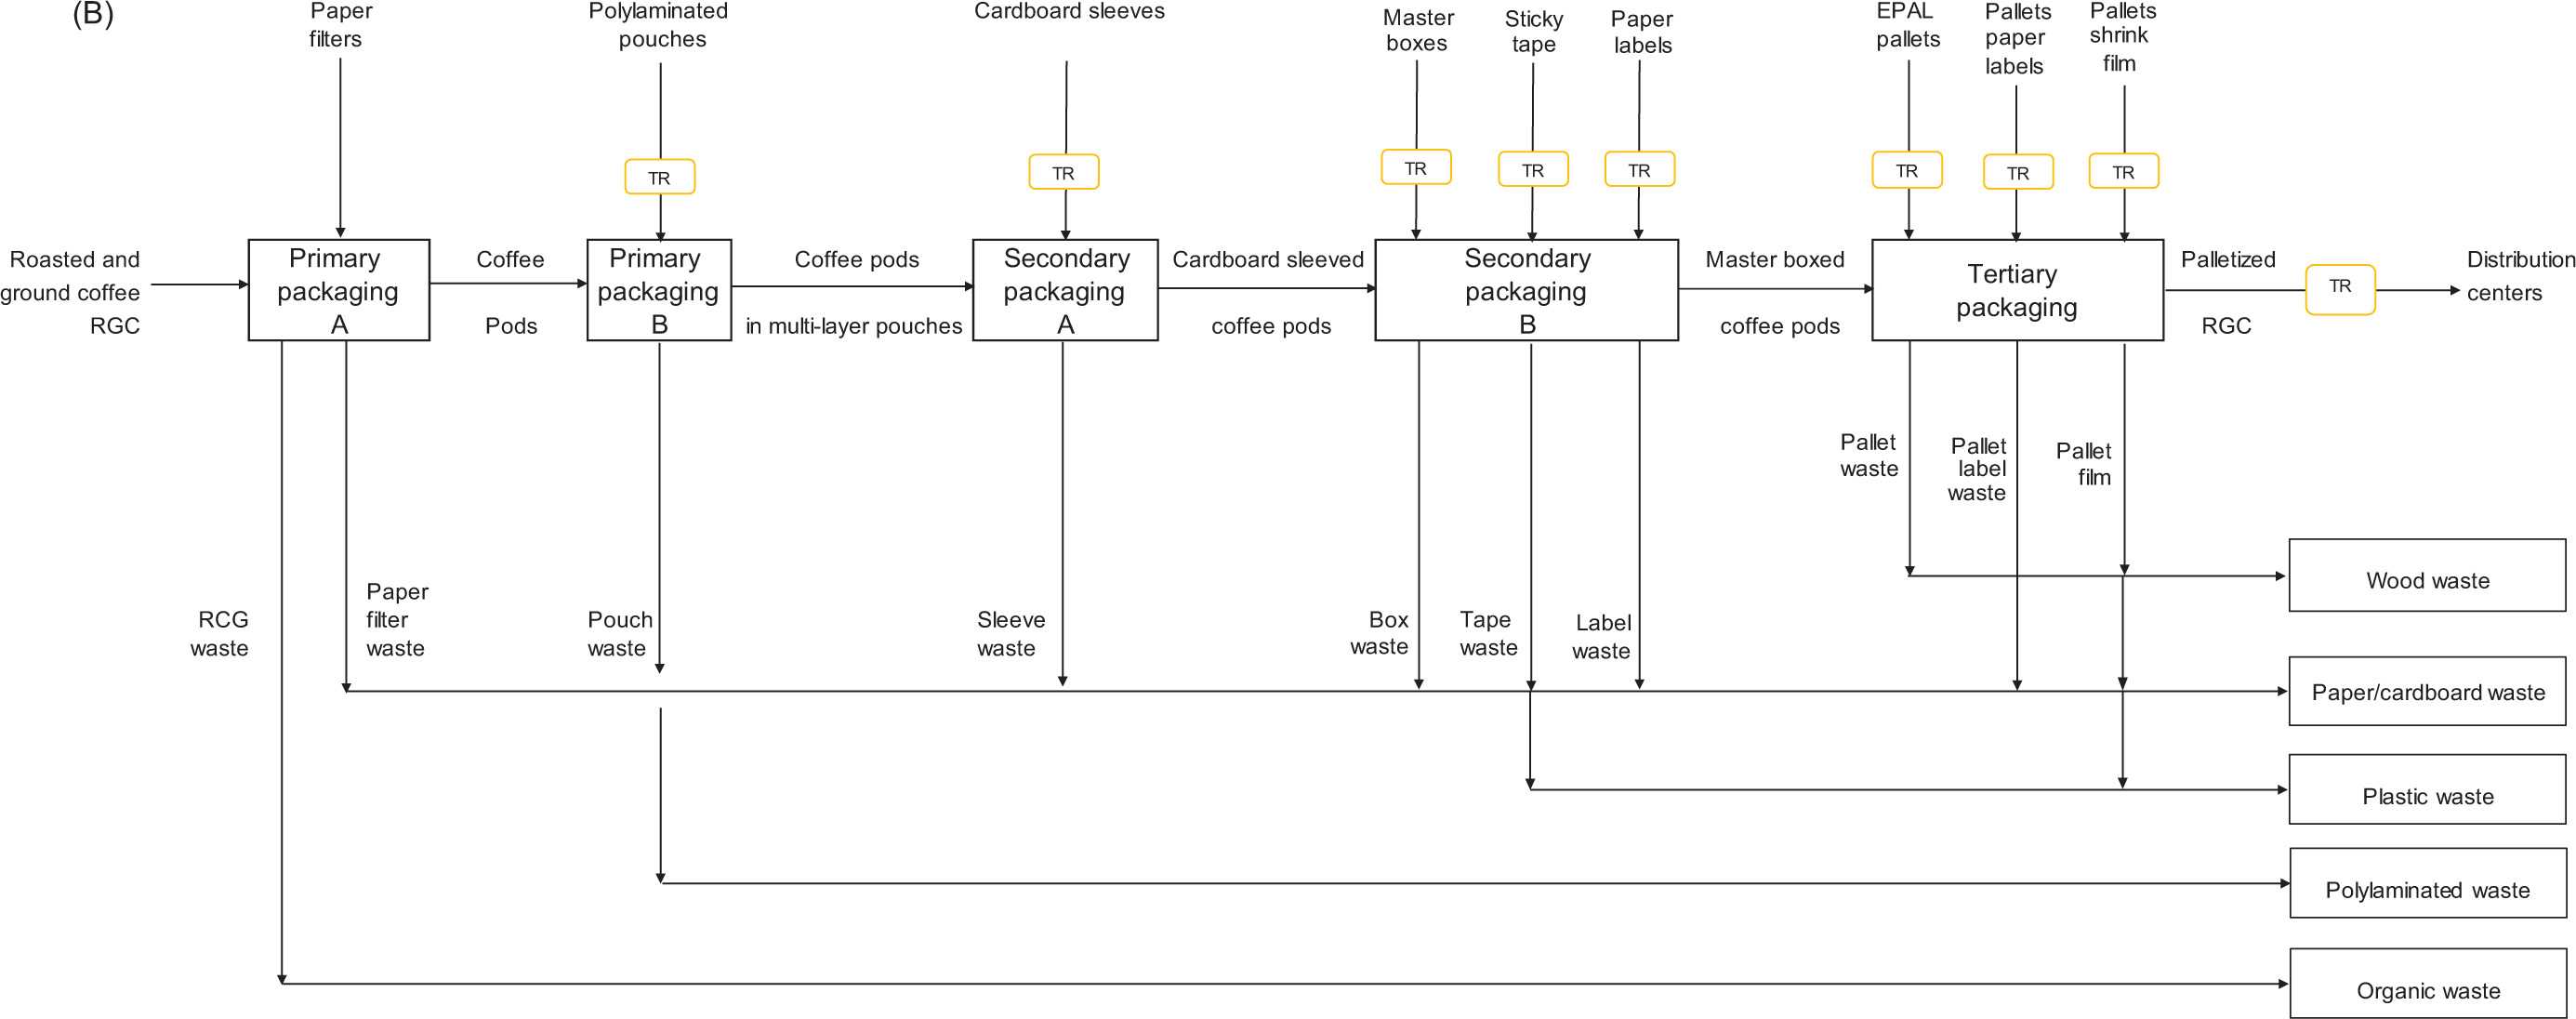
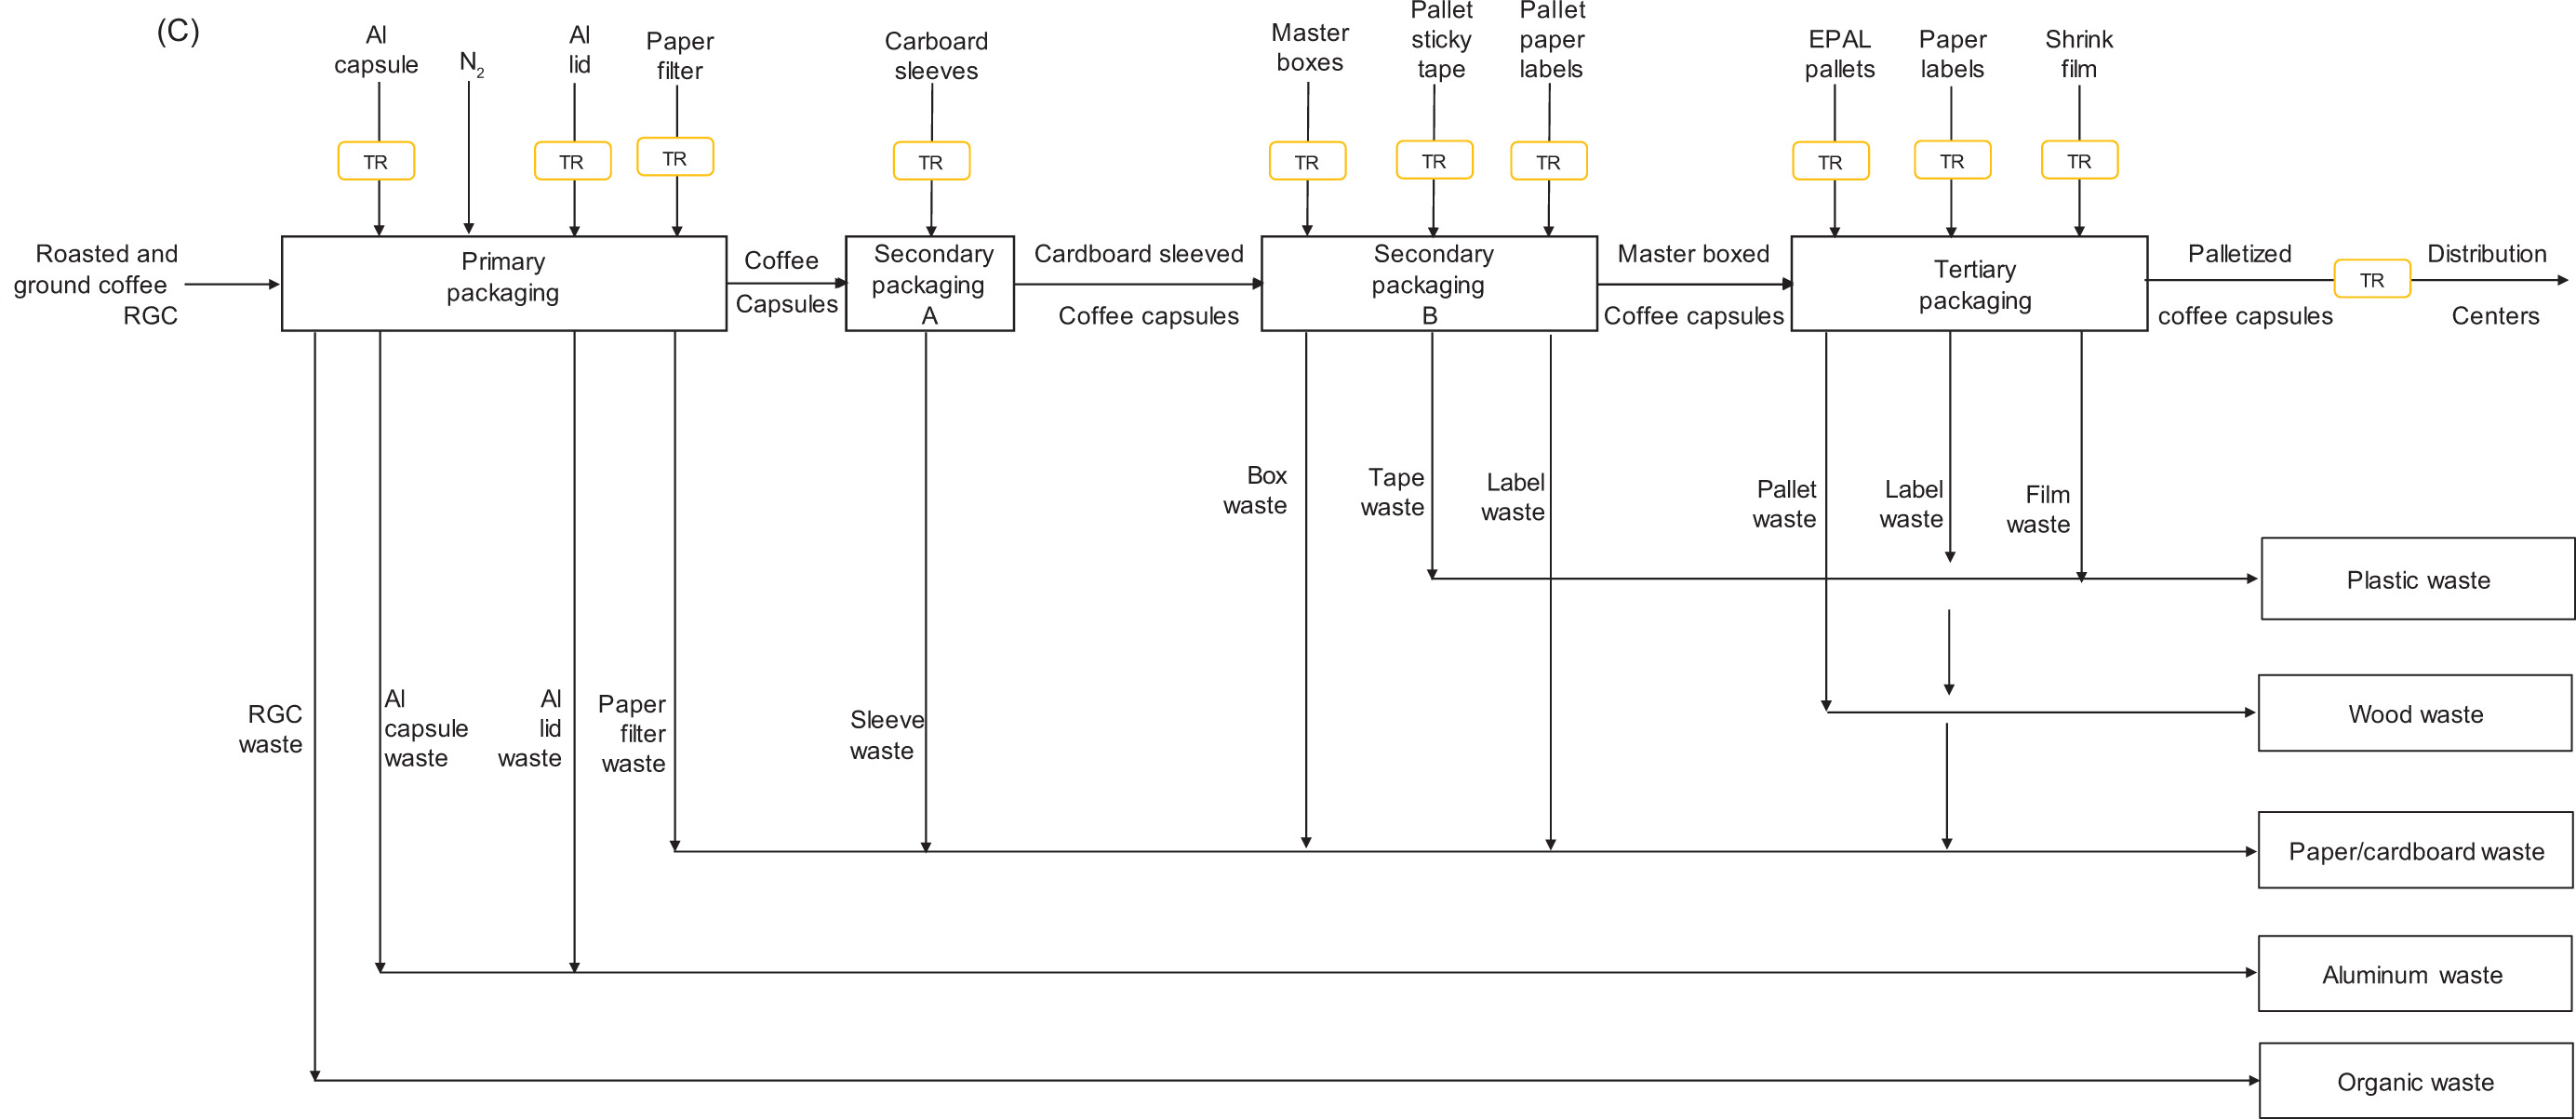
The main problem with small coffee portions is the high ratio between the mass of the overall packaging materials and the ground coffee. While GCBs are generally packed in 1,000-kg flexible PE supersacks weighing approximately 3 kg each, they are transported by truck from the farm gate to the nearest harbor. From there, they are dispatched by cargo to a nearby harbor in the processing country, and then by truck to the roasting and grinding plant. At plant, RGC powder of an appropriate size is mixed before being packaged in various formats to be commercially available in supermarkets or online. As an example, to illustrate different packaging material-to-ground coffee ratios, diverse formats as shown in Table 5, all considered primary packaging units, are examined. Thus, based on the available information and comparisons to similar products, such data provide informed estimates of the single-serving portions of coffee available on the market.
Table 5. Mass of packaging material and ground coffee for various primary single-serving formats.
| Format | Description | Main items | Item mass (g) | Source/comments |
|---|---|---|---|---|
| F1 | 250-g coffee flexible multilayer bag | RGC PE (0.735)-Al (0.143)-PP (0.122) bag |
250.0 7.86±0.20 |
Cibelli et al., 2021 |
| F2 | Coffee pods | RGC Paper filter PE-Al-PET pouch |
7.23±0.02 0.180±0.002 1.51±0.01 |
Cibelli et al., 2021 |
| F3 | Coffee capsules | RGC Al capsule (AIC) Upper Al lid Abaca-based filter Nitrogen fill |
~5.5 1.0 0.25 ~0.28 0.43 |
OnWin, n.d.a |
| F4 | RGC PP capsule Upper Al lid Paper-based filter Nitrogen fill |
~5.5 3.0 0.25 ~0.28 0.43 |
AFPAK, n.d. | |
| F5 | RGC PE-Al-PET capsule Upper Al lid Nitrogen fill |
5.75±0.07 1.05±0.02 0.110±0.002 0.43 |
Cibelli et al., 2021 | |
| F6 | RGC PBS/PLA capsule PLA-based lid PLA-based filter Nitrogen fill |
~5.5 ~2.6 ~0.3 ~0.3 0.43 |
OnWin, n.d.b | |
| F7 | RGC Paper-based capsule Upper paper-based lid PLA-based filter Nitrogen fill |
~5.5 ~2.6 ~0.3 ~0.3 0.43 |
1 | |
| F8 | Coffee balls | RGC Biopolymer film coating |
5.6 (5.3-5.9) ~0.3 |
2 |
Notes: 1Nespresso® has not disclosed exact mass breakdown of paper-based capsules (https://nestle-nespresso.com/nespresso-unveils-new-range-home-compostable-coffee-capsules?utm_source=chatgpt.com; accessed: 10 June 2025). Therefore, these estimates are based on comparable compostable capsules.
2CoffeeB did not disclose the specific biopolymer or the mass of the coating film used. Therefore, an average coffee ball with a 15-mm radius was assumed. This ball was presumed to be coated with an aqueous solution of Arabic gum (33.33% w/w concentration, 1,125-kg/m3 density), forming a 282-mm wet film. This film was then dried to a 99% (w/w) solid content.
RGC: roasted and ground coffee; PBS: poly-(butylene succinate); F3: Al capsule; F4: PP capsule; F5: multilayer PE-Al-PET capsule; F6: PBS/PLA capsule; F7: paper-based capsule; F8: coffee balls.
The secondary packaging differs depending on the format.
For F1 (250-g flexible multilayer bag), the secondary packaging is a carton (CA), sealed with a 7-g sticky tape strip and labeled with a 2-g paper tag. In contrast, for F2–F8, the secondary packaging consists of the following two components:
-
Item A is typically a self-sealing corrugated paperboard box (CB) designed to hold either 20 pods or 10 capsules.
-
Item B is a cardboard master box (MB) sealed with sticky tape and paper-labeled in the same manner as the F1 carton (CA).
Finally, the tertiary packaging consists of a 14-kg European Pallet Association (EPAL) wood pallet (1,200-mm length [L] × 800-mm width [W] × 144-mm height [H]), which is 99.8% reusable. This pallet is used to assemble multiple cartons or master boxes per layer. These layers are then secured with a stretched PE film and labeled with two paper tags, each weighing 3.11 g.
As an example, Figure 6 shows the block diagram of packaging processes for some of the coffee formats (F1–F3) listed in Table 5. Specifically, the formats are F1 (RGC in poly-laminated bags, as shown in Figure 6A), F2 (coffee pads, as shown in Figure 6B), and F3 (coffee aluminum capsules; see Figure 6C).
Figure 6. Schematic diagrams of packaging processes for ground coffee in (A) 250-g multilayer bags (F1); (B) 44-mm ESE pads (F2); and (C) aluminum capsules (F3).
The packaging process for coffee capsules (F3) differs from that of coffee pads (F2) primarily because of their primary packaging. For capsules, this primary packaging (denoted as “A” in the diagram) can be made from a variety of materials, including aluminum, PP, poly-laminated materials, PLA-based composites, or paper-based composites. Additionally, capsules require a nitrogen fill to enhance the freshness and extend the shelf-life of coffee serving.
Table 6 provides comprehensive details about the primary, secondary, and tertiary packages of various coffee formats, allowing for a clear illustration of the packaging material-to-ground coffee ratio (PM/RGC [kg/kg]) and, consequently, the waste implications associated with single-use coffee servings.
Table 6. Mass of any component of primary, secondary, and tertiary packages for roasted and ground coffee (RGC), as referred to the eight formats described in Table 5.
| Packaging format | F1 | F2 | F3 | F4 | F5 | F6 | F7 | F8 | Unit |
|---|---|---|---|---|---|---|---|---|---|
| Primary packaging A | MLB | CPO | AlC | PPC | PAPC | CP | PC | CB | |
| RGC mass | 250 | 7.23 | 5.5 | 5.5 | 5.75 | 5.5 | 5.5 | 5.6 | g |
| Vacuum pack mass | 7.86 | – | – | – | – | – | – | – | g |
| Upper lid | – | – | 0.25 | 0.25 | 0.11 | 0.3 | 0.3 | – | g |
| Paper filter mass | – | 0.18 | 0.28 | 0.28 | – | 0.3 | 0.3 | – | g |
| Biopolymer film coating | – | – | – | – | – | – | – | 0.3 | g |
| Nitrogen fill | – | – | 0.43 | 0.43 | 0.43 | 0.43 | 0.43 | – | g |
| Capsule mass | – | – | 1.00 | 3.00 | 1.05 | 2.6 | 2.6 | g | |
| Overall mass of primary package A | 257.86 | 7.41 | 7.46 | 9.46 | 7.34 | 9.13 | 9.13 | 5.90 | g |
| Primary packaging B | – | Pouch | – | – | – | – | – | – | |
| Poly-laminated pouch mass | – | 1.51 | – | – | – | – | – | – | g |
| Overall mass of primary package B | – | 8.92 | – | – | – | – | – | – | g |
| Secondary packaging A | – | Sleeve pack | Sleeve pack | ||||||
| Dimensions | – | L10×W10×H22 | L14×W7×H3 | L14 × W7 × H3 | L14×W10×H4 | cm | |||
| No. of pods or capsules/box | – | 20 | 10 | 10 | 10 | 10 | 10 | 9 | - |
| Corrugated paperboard sleeve mass | – | 64.8 | 12.59 | 12.59 | 12.59 | 12.59 | 12.59 | 14.4 | g |
| Overall mass of secondary A package | – | 243.2 | 87.2 | 107.2 | 86.0 | 103.9 | 103.9 | 67.50 | g |
| Secondary packaging B | CA | MB | MB | MB | MB | MB | MB | MB | |
| Dimensions | L40×W18×H15 | L80×W30×H45 | L40×W30×H45 | L40×W30×H45 | cm | ||||
| CA or MB mass | 318 | 1,470 | 870 | 870 | 870 | 870 | 870 | 640 | g |
| No. of pouches per CA/sleeves per MB | 20 | 48 | 156 | 156 | 156 | 156 | 156 | 120 | - |
| Sticky tape mass | 7 | 7 | 7 | 7 | 7 | 7 | 7 | 7 | g |
| Paper label mass | 2 | 2 | 2 | 2 | 2 | 2 | 2 | 2 | g |
| Overall mass of secondary packages | 5.475 | 13.144 | 14.472 | 17.592 | 14.284 | 17.077 | 17.077 | 8.740 | kg |
| Tertiary packaging | EWP | EWP | EWP | EWP | EWP | EWP | EWP | EWP | |
| No. of CA or MBs per layer | 12 | 4 | 8 | 8 | 8 | 8 | 8 | 8 | - |
| No. of layers per pallet | 12 | 4 | 4 | 4 | 4 | 4 | 4 | 4 | - |
| PE film mass | 0.821 | 0.912 | 0.912 | 0.912 | 0.912 | 0.912 | 0.912 | 0.912 | kg |
| Pallet paper labels | 3.11 | 3.11 | 3.11 | 3.11 | 3.11 | 3.11 | 3.11 | 3.11 | g |
| Overall RGC mass | 720.0 | 111.1 | 274.6 | 274.6 | 287.0 | 274.6 | 274.6 | 193.5 | kg |
| Overall mass of tertiary package | 803.3 | 225.2 | 478.0 | 577.9 | 472.0 | 561.4 | 561.4 | 294.6 | kg |
| Packaging-to-RGC mass ratio | 0.116 | 1.028 | 0.741 | 1.105 | 0.644 | 1.045 | 1.045 | 0.522 | kg kg-1 |
Notes: AlC: AI capsule; CB: coffee balls; CP: PBS/PLA capsules; CPO: coffee pad; EWP: European Pallet Association (EPAL) wooden pallet; MB: cardboard master box; MLB: multi-layer bag; PAPC: PE-Al-PET capsule; PC: paper-based capsule; PPC: PP capsule.
While single-serve options, such as coffee balls and diverse capsules, offer convenience, they inherently utilize more packaging material relative to the coffee contained. For example, the coffee ball format (F8), designed for nine spherical coffee portions (Figure 5H), has a packaging-to-RGC mass ratio (PM/RGC) of 0.522 kg of packaging/kg of RGC. The biopolymer film coating applied directly to coffee balls represents quite a lightweight primary packaging. This ratio means that for every kilogram of coffee, more than half a kilogram of packaging material is used.
Comparing this to other single-serve formats shown in Table 6, coffee pods (F2) show a significantly higher ratio of 1.028 kg/kg of RGC, indicating they use more than 1 kg of packaging for every kilogram of coffee. Diverse capsules (F3–F7), each weighing from 1 g to 3 g, exhibit varied features. Their PM/RGC ratios range from 1.105 kg/kg in the case of PP capsules (F4) to 0.741 kg/kg in the case of Al Nespresso® Espresso capsules (F3), and down to 0.644 kg/kg in the case of poly-laminated capsules (F5). Among all these single-serve options, coffee balls (F8) at 0.522 kg/kg demonstrate the lowest PM/RGC mass ratio, indicating that they are the most material-efficient single-serve format presented in Table 6.
In stark contrast, a 250-g poly-laminated bag of ground coffee, a common format for use with Moka pots, espresso machines, and other traditional brewing systems, boasts a significantly lower PM/RGC ratio of approximately 0.12 kg/kg. This highlights a substantial difference in material efficiency: traditional bulk packaging requires nearly five times less packaging material per unit of coffee, compared to the coffee ball format which is significantly more efficient than all single-serve options.
This comparison underscores a fundamental trade-off: the convenience and portion control offered by single-serve coffee systems typically come at the cost of increased packaging material per serving. While innovations in materials and design, such as the molded cardboard for coffee balls, aim to minimize this footprint, they still face the challenge of providing individual protection and containment for small quantities of coffee, which inherently leads to a higher packaging-to-product ratio than larger, multi-serve formats. Consequently, the coffee ball format’s lower PM/RGC ratio among single-serve options suggests a potentially more environment-friendly profile in terms of material consumption for this category. However, it is important to note that this analysis solely considers mass and does not encompass other environmental impacts, such as recyclability, end-of-life options, or energy consumption during coffee preparation.
Environmental impact of coffee’s consumer use phase
The environmental impact of coffee’s use phase primarily stems from the energy needed for brewing and washing reusable cups. In contrast, RGC itself typically has a minimal impact during storage, as it is kept at room temperature in airtight, vacuum-sealed, or inert gas-filled containers.
A key factor in this phase’s PEF is the choice of coffee vessel: single-use or reusable.
Common reusable options include cups made from glass, porcelain, or earthenware. Mugs are another popular choice, usually larger, cylindrical containers with a handle, often made of ceramic or stoneware. For on-the-go coffee, travel mugs are used widely. These are generally reusable and come with a lid, as do insulated or thermal mugs, which are specifically designed to keep drinks hot or cold. Lids on these mugs often feature a drinking spout or a sip opening, while iced beverages commonly use lids with a straw aperture. Reusable cups and mugs typically have a lifespan of around 500 use cycles (Chayer and Kicak, 2015).
For disposable options, paper or plastic cups are very common. While Styrofoam cups are also disposable, their use has declined due to environmental concerns (Mindful Sip, 2024). A disposable cup might also include a cardboard sleeve to protect hands from heat. To help mix ingredients, such as sugar or milk powder, single-use cups often include a spoon or a stirring stick.
Brewing a cup of coffee, using the systems described in Section 2.5, primarily consumes electricity or natural gas from the national grid.
Washing reusable cups can be performed either manually (handwashing) or with a dishwasher. Handwashing typically uses about 0.5 L of 40 °C water per cup. Dishwashers, on the other hand, uses anywhere from 9.5 L (Cibelli et al., 2021) to 18 L (Humbert et al., 2009) of water per cycle. A dishwasher generally consumes 10 g of detergent per cycle, regardless of its loading capacity. This capacity can range from 40 ceramic mugs (300 g each; Humbert et al., 2009) to 56 earthenware cups (120 g each; Cibelli et al., 2021). Dishwasher’s energy consumption also varies significantly, ranging from 1.05 kWh to 1.4 kWh per cycle. However, this can be as low as 0.8 kWh per cycle for an Energy Class A+++ dishwasher running an “express wash” function, which cuts the running time by 50% (Cibelli et al., 2021). These figures clearly show how the energy consumption for washing cups and mugs can differ greatly based on the dishwasher type and its settings, offering a range of possibilities for evaluating the overall energy efficiency and environmental impact.
While the energy used for brewing and washing reusable cups are key environmental factors in the coffee use phase, a comprehensive LCA of reusable coffee cups, as detailed by Almeida et al. (2018), provided deeper insight into their cradle-to-grave environmental impact when benchmarked against single-use and other reusable alternatives.
KeepCups, for example, are reusable coffee cups designed to replace single-use disposables. Created in Australia in 2007 by siblings Abigail and Jamie Forsyth, they aimed to reduce the environmental impact of single-use coffee cups, which often end up in landfills because of their mixed material construction (paper and plastic lining) making recycling difficult (https://www.madesustained.nl/project/keepcup/; accessed: 5 June 2025). These cups were designed to encourage a shift in consumer behavior toward habitually reusing their own cups for takeaway beverages, having been tested for hundreds or even thousands of use cycles. They are made from various materials, including PP, tempered glass, and stainless steel, available in standard disposable cup sizes (e.g., 8, 12, and 16 oz), and feature interchangeable parts (such as a lid or band), allowing users to replace a single damaged component, rather than discarding the entire cup. They are also easily washed in dishwashers.
Almeida et al. (2018) highlighted several environmental benefits of such reusable cups:
-
Reduced carbon footprint achievable after a relatively small number of uses (e.g., eight uses for a Thermal KeepCup vs. a paper cup, or four uses vs. a compostable cup). Over a year of light use (250 coffees/year), a thermal KeepCup can reduce its carbon footprint by 77–87%, compared to disposables.
-
Reduced waste to landfill because these cups replace disposable cups.
-
Lower energy and water use (over its lifespan), this benefit being particularly pronounced with energy-efficient washing practices. The choice of electricity source for washing (grid vs. renewables) significantly influences these impacts.
In essence, the study conducted by Almeida et al. (2018) reinforced that reusable cups, such as KeepCups, generally offer a more environment-friendly option than single-use alternatives. However, it also underscored that the use phase, particularly the washing process, remains the most significant environmental hotspot. This emphasizes the fundamental importance of influencing user behavior through education on energy-efficient washing practices, such as ensuring dishwashers are fully loaded.
Environmental impact of coffee waste disposal
The disposal phase of coffee consumption significantly contributes to its overall PEF, involving waste streams generated throughout green coffee processing, packaging, and post-consumer stages. Both upstream industrial processes and downstream consumer behaviors influence the fate of organic and packaging waste.
Waste management practices vary across countries. In Italy, for example, post-consumer organic and packaging wastes are managed according to national municipal solid waste (MSW) guidelines (Aterini, 2025; Evangelista et al., 2023; Italian Institute for Environmental Protection and Research [ISPRA], 2024; Pavan, 2024; Pergolizzi, 2024). Table 7 summarizes the Italian waste management scenarios for 2022.
Table 7. The overall Italian waste management scenarios for packaging and organic and undifferentiated wastes in 2022.
| Waste management scenarios | Landfill (%) | Recycling (%) | Incineration (%) | References |
|---|---|---|---|---|
| Organic waste | 21.9 | 49.2 | 28.9 | Aterini, 2025; ISPRA, 2024 |
| Paper and cardboard waste | 13.0 | 81.2 | 5.8 | Evangelista et al., 2023 |
| Wood waste | 35.6 | 62.7 | 1.7 | Evangelista et al., 2023 |
| Plastic waste | 10.6 | 48.9 | 40.5 | Evangelista et al., 2023 |
| Glass waste | 19.2 | 80.8 | 0.0 | Evangelista et al., 2023 |
| Aluminum waste | 22.2 | 73.6 | 4.2 | Evangelista et al., 2023 |
| Iron waste | 19.4 | 80.6 | 0.0 | Evangelista et al., 2023 |
| Undifferentiated waste | 49.4 | - | 50.6 | Pavan, 2024 |
These data highlight high recycling proportions for paper and cardboard (81.2%), aluminum (73.6%), and wood (62.7%) as well as moderate recycling for plastics (48.9%). In 2022, 49.2% of organic waste was recycled (ISPRA, 2024), with 44% processed into compost and 5.2% treated through anaerobic digestion (Pergolizzi, 2024); 21.9% was landfilled (Aterini, 2025), and the remaining 28.9% was incinerated with energy recovery.
At the industrial scale, green coffee processing and packaging generate multiple waste streams, each managed differently:
-
Organic waste: Roasted ground coffee from broken bags, pods, or capsules.
-
Plastic waste: PE supersacks, multilayer bags or pouches for coffee pods, and stretch films.
-
Paper and cardboard waste: Rejected cartons, corrugated paperboard boxes, master boxes, and labels.
-
Wood waste: Wooden pallets managed through repair and reuse or disposed as wood waste.
Table 8 summarizes the percentage of packaging materials discarded during green coffee transportation (TR) and packaging at the industrial scale as reported by Cibelli et al. (2021).
Table 8. Percentage of packaging materials discarded during the processing of green coffee beans (GCBs) and roasted and ground coffee (RGC) at an industrial scale as reported by Cibelli et al. (2021).
| Processing and packaging materials discarded | Discarded fraction (%) |
|---|---|
| Primary packaging of GCBs | |
| PE supersacks | 5.0 |
| Primary packaging of RGC | |
| Ground coffee waste | 0.3 |
| Poly-laminated bag waste | 1.5 |
| PE foil per multilayer bags | 0.3 |
| Pad paper filter waste | 30.0 |
| Poly-laminated pouch waste | 0.64 |
| Capsule and paper- or PLA-based filter waste | 1.0 |
| Capsule lid waste | 1.0 |
| Secondary packaging of RGC | |
| Cardboard carton, box, or master box waste | 0.4 |
| Sticky tape waste | 0.2 |
| Paper label waste | 0.2 |
| Tertiary packaging of RGC | |
| EPAL pallet waste | 0.2 |
| Stretch and shrink PE film waste | 0.2 |
| Pallet adhesive label waste | 0.2 |
Note: EPAL: European Pallet Association; PE: polyethylene.
Globally, waste treatment practices for coffee packaging and SCGs differ significantly. In Switzerland, aluminum, plastic, and bioplastic capsules along with SCGs are often incinerated without separation (Dubois et al., 2011). In contrast, in the United States, most SCGs are landfilled or incinerated, with only 3.9% composted (Quantis, 2015), contributing to substantial GHG emissions, particularly methane and CO2.
While numerous LCA studies consistently identify coffee production (cultivation, harvesting, and processing) as the principal contributor to coffee’s environmental impact (Sarmento dos Muchangos et al., 2025), waste management remains a relevant factor, especially for single-serve systems utilizing non-recyclable packaging.
The LCA conducted by Dubois et al. (2011) for Nespresso® examined espresso prepared with various capsule types (Nespresso® Espresso Al, PP-Al-PE, PP-PET, and polylactate-starch). The main contributors to GHG emissions were in the following descending order: preparation stage, coffee production, packaging production, and disposal. Aluminum capsules showed the lowest GHG emissions, while bioplastic capsules disposed of in landfills resulted in the highest GHG emissions because of methane release.
More recent evaluations done by Quantis (2024), using aluminum capsules as the baseline (100%), revealed distinct Global Warming Potential (GWP) profiles for different European brewing systems:
-
Paper-based Nespresso® capsules exhibited the lowest GWP, at ~90% of the aluminum capsule’s impact.
-
Compostable coffee balls followed at ~105%.
-
Unportioned systems showed consistently higher GWP values: full automat (~120%), drip filter (~130%), and Moka (~135%), primarily because of higher coffee quantities per serving.
The earlier study conducted by Quantis (2015) emphasized that consumer behaviors, such as over-preparation, freshness loss, and prolonged warming, further elevate the GHG impacts of unportioned systems. Even minimal over-preparation (2%) or freshness loss (3%) can make drip brewing more impactful than optimized capsule systems.
Beyond GWP, Quantis (2024) assessed 16 environmental impact categories, finding that paper-based capsules generally outperformed aluminum across most indicators. However, regardless of the brewing system, coffee production consistently remained a dominant contributor to environmental impacts, with capsule manufacturing representing a secondary yet significant factor for portioned systems.
In summary, the environmental impact of disposal of coffee waste is strongly influenced by the following:
-
The brewing system employed (portioned vs. unportioned)
-
The waste management infrastructure at national and municipal levels
-
Consumer behaviors affecting brewing efficiency and waste generation
-
The development and implementation of circular economy solutions for both packaging and SCGs.
Thus, reducing coffee’s environmental burden requires a dual strategy:
-
Optimizing brewing systems for portion control, efficiency, and reduced coffee waste.
-
Establishing robust circular management pathways for both packaging materials and SCGs.
Valorization of spent coffee grounds in circular bioeconomy
The food industry’s growing interest in circular economy models to enhance product and service sustainability has intensified focus on recycling waste and residues. In this context, coffee processing by-products, which vary based on processing methods (wet, dry, roasting, and infusion), include coffee pulp, husks, silver husks, and notably SCGs. SCG constitutes the most abundant waste, accounting for 45% of residues from coffee beverage preparation (Murthy and Naidu, 2012). Approximately 2 kg of wet SCGs are generated per kilogram of instant coffee, while 0.65 kg of SCGs result from 1 kg of green coffee (Janissen and Huynh, 2018). This significant interest in coffee waste stems from coffee’s global popularity as the second most traded product, cultivated in roughly 80 countries (Murthy and Naidu, 2012).
Forcina et al. (2023) conducted a comparative LCA of various SCG reuse strategies, highlighting their environmental implications and associated recovery challenges. With an estimated 60 million MT of SCGs generated annually worldwide, its effective management and valorization through circular economy strategies are urgently needed. SCG is a versatile resource because of its rich composition of polysaccharides, lipids, proteins, and bioactive compounds, such as polyphenols and caffeine.
Potential valorization avenues for SCG, as explored in literature, include the following (Arias et al., 2023; Forcina et al., 2023; Hejna, 2021):
-
Compost and fertilizers: SCG is rich in nitrogen and other nutrients, making it an excellent soil amendment to enhance fertility and promote plant growth. It can also be used as a substrate for mushroom cultivation.
-
Biofuels and bioenergy: SCG can be converted into biodiesel, bioethanol, biogas, or bio-pellets, serving as a source of renewable energy to reduce dependence on fossil fuels.
-
Building materials: SCG can be incorporated into construction materials, such as bricks, to enhance their sustainability and efficiency.
-
Polymer applications: Coffee by-products, including SCG, offer significant potential in polymer chemistry and technology. They are used as fillers in polymer composites to enhance mechanical properties (e.g., stiffness and tensile strength), reduce material costs, and improve biodegradability. Furthermore, they can serve as a source for bio-based monomers/plasticizers (e.g., from SCG lipids) and as functional additives imparting properties such as protection from ultraviolet (UV) radiation.
-
Food industry: SCG can be transformed into flour rich in dietary fiber and antioxidants, suitable for baking and other culinary applications.
-
Cosmetics and skincare: The bioactive compounds and abrasive texture of SCG make it suitable for use in exfoliants, scrubs, and other skincare products.
-
Adsorbents: SCG is used to remove heavy metals or other pollutants from water.
-
Biochar production: Pyrolysis/gasification of SCG can produce bio-oil, syngas, and biochar, the latter improving soil quality, carbon sequestration, and water retention.
The environmental performance of SCG reuse strategies is a critical assessment component. Traditional disposal via landfilling is highly problematic, because SCG anaerobic decomposition leads to significant emissions of potent GHGs, such as CH4 and CO2. Furthermore, harmful chemical substances such as caffeine, tannins, and polyphenols can leach into the environment, potentially impacting soil fertility and groundwater. Conversely, valorization strategies aim to mitigate these negative impacts. For example, biofuel production from SCG can reduce dependence on fossil fuels, thereby lowering associated GHG emissions, and composting SCG can enrich soil and reduce the need for synthetic fertilizers.
According to the LCA study done by Forcina et al. (2023), SCG landfilling exhibited the highest environmental burden across all categories, with a GWP of 0.15 kg CO2e/MT of SCG. Composting resulted in an approximate 84% reduction in GWP compared to landfilling (0.023 kg CO2e/MT), and an 18% decrease in emissions into air. Production of biodiesel yielded negative values across all categories. Notably, its GWP was -0.35 kg CO2e/MT, meaning it actively reduced the overall carbon footprint by displacing fossil fuels, although it yielded only 1% decrease in direct process emissions into air compared to landfill. Finally, partial incorporation of SCG in bricks appeared to be highly effective for reducing atmospheric pollutants, thanks to a remarkable 76% decrease in emissions into air compared to landfilling.
Forcina et al. (2023) unequivocally demonstrates that all valorization strategies for SCGs (composting, biodiesel production, and incorporation into bricks) offer substantial environmental advantages over traditional landfilling. Nevertheless, the success of these waste management alternatives is significantly influenced by transportation distance. Assuming a 100-km transportation distance for landfill disposal, Forcina et al. (2023) estimated break-even distances, beyond which transport impacts negate environmental benefits: 150 km for biodiesel production, 500 km for composting, and 1,800 km for brick-production. Compared to average distances in the Italian scenario, composting (average 40 km) and brick production (average 460 km) proved environmentally beneficial, their real distance being less than their break-even points. On the contrary, biodiesel production in Italy would not explicit its environmental benefits because it is carried out in plants collecting raw materials from about 500-km distance, considerably higher than its 150-km break-even distance.
Despite the promising potential of SCG valorization, the practicalities of collecting and processing this waste present significant hurdles, particularly when considering sources beyond large-scale industrial operations:
-
Recovery from house bins: Collecting SCG from individual household bins is exceptionally difficult and inefficient. The small quantities generated per household, coupled with contamination from other waste streams, make large-scale collection impractical and economically unfeasible without dedicated and widespread separate collection systems. The moisture content in fresh SCG also adds to collection and storage challenges, as leads to growth of mold.
-
Exhausted coffee capsules or pods: Coffee capsules and pods, while convenient for consumers, pose a distinct challenge. They are often made of mixed materials (plastic, aluminum, and foil) and still contain residual ground coffee. Separating SCGs from capsule material is a complex manual process, making SCGs difficult to recycle through standard municipal recycling streams. Specialized collection schemes, often managed by manufacturers, are required, but their effectiveness relies heavily on consumer participation, which is often low because of the added hassle. The very nature of convenience that drives their popularity works against effective post-consumer recovery.
-
Collecting sufficient quantities for industrial-scale application: The fragmented and dispersed nature of SCG generation, especially from domestic and small commercial sources (e.g., cafes), makes it challenging to aggregate enough to feed industrial-scale valorization facilities. Industrial applications require a consistent and substantial feedstock supply to be economically viable. While large coffee-processing plants or instant coffee manufacturers generate significant volumes, establishing robust collection networks that can gather SCG from myriad smaller producers (households, offices, and small cafes) without incurring prohibitive logistical and economic costs remains a major barrier. The need for efficient collection and separation systems is paramount to unlock the full potential of SCG as a valuable resource.
While all reuse scenarios offer environmental benefits over landfilling, especially in terms of reducing the overall emissions, the practical applicability and true environmental advantage elicits a strategic, localized approach. This involves prioritizing collection and processing methods that minimize transport distances, alongside continued research and development into diverse valorization pathways to match regional needs and infrastructure. Investing in robust, localized collection systems, especially for decentralized sources such as households and cafes, is crucial to unlock fully the potential of SCG within a truly sustainable circular bioeconomy.
Methodology
This work was based on the LCA procedure (International Organization for Standardization [ISO] 14040, 2006a, 14044, and 2006b).
Goal and scope definition
The purpose of this study was to assess the environmental impact of a 40-mL cup of Moka or espresso coffee with no additional ingredients (e.g., sugar and milk) according to the guidelines of the Italian Coffee Committee (Comitato Italiano del Caffè, 2018, 2020). Coffee brewing was carried out using the below-mentioned systems and the specific coffee formats (F1–F8) outlined in Table 6:
-
A three-cup Moka pot (cod. Linea-Moka-Induction-Oro: Bialetti Industrie SpA, Coccaglio, BS, Italy), heated by an induction stove.
-
An espresso coffee machine Gaggia Viva RI8433/11 (Gaggia SpA, Gaggio Montano, BO, Italy) having a nominal power of 1,025 W.
-
A pod coffee machine Didì Borbone Blue Pods (Didiesse Srl, Caivano, NA, Italy) having a nominal power of 450 W.
-
A capsule coffee machine Nespresso D40 Inissia Black (DēLonghi Appliances Srl, Treviso, Italy) having a nominal power of 1,260 W.
-
A CoffeeB Horizon machine (https://www.coffeeb.com/media/d8/32/18/1731324632/2024-10-17%20CoffeeB_Horizon_Manual_EN.pd; accessed: 15 June 2025) having a nominal power of 1,450 W.
Roasted and ground coffee, specifically in laminated bag packaging (F1), was utilized for brewing with (a) Moka pot, (b) espresso coffee machine, and (c) reusable stainless steel coffee capsules developed by CAPSME (Figure 5G).
To assess the required number of individual coffee format units, their associated packaging and the total output of 40-mL Moka or espresso cups, a functional unit of 720-kg RGC was selected. This amount corresponds to the RGC packed in 250-g flexible multi-laminated bags, assembled on a single EPAL wood pallet (Table 6).
Owing to the varying environmental impacts of green coffee bean production—depending on coffee variety, production location, agricultural practices, and processing of harvested coffee cherries (Section 2.2) as well as transportation and processing at the roaster plant—the system boundary for this streamlined LCA study referred to a generic roasted coffee bean mix. It included the following processing steps, as illustrated in Figure 7:
Figure 7. System boundary of an LCA study carried out to assess the environmental impact of a 40-mL cup of Moka or espresso coffee using different brewing systems.
-
Production of primary, secondary, and tertiary packaging materials.
-
Packaging ground coffee in different formats as described in Table 6.
-
Transport of the palletized product to the platforms of distribution centers (DCs) and then to the points of sale (PoS).
-
Consumer use of RGC using the above-mentioned brewing systems, powered by electricity drawn from the Italian low-voltage grid.
-
Transport of post-consumer wastes from consumers’ houses (CHs) to waste collection centers (WCCs).
-
End-of-life processes of SCGs.
-
End-of-life processes of packaging waste.
Exclusions from system boundaries
Several elements from the system boundaries of this study were excluded:
-
Production, cleaning, and disposal of capital goods (e.g., machinery and coffee machines), as detailed in Section 6.4.4 of the British Standards Institution (BSI, 2011).
-
Travel by personnel.
-
Transportation of consumers to and from PoS, as detailed in Section 6.5 of BSI (2011).
Geographical, temporal, and technological boundaries
Following the Publicly Available Specification (PAS) 2050, Section 7.2 of BSI (2011), the datasets reflected typical process configurations and the current technical and environmental standards of industrial-scale coffee roasters.
Data used
For primary data, information on by-product formation (specifically SCGs and packaging waste) was sourced from Tables 2 and 6.
Secondary data were obtained from the Ecoinvent v. 3.10 database, integrated into the LCA software SimaPro Craft 10.2.0.2 (Pré Consultants, Amersfoort, NL).
In essence, this streamlined LCA aimed to evaluate the impact of various coffee brewing methods, independent of the origin of green coffee beans and its subsequent processing into RGC.
Life cycle inventory analysis
Coffee packaging
Roasted and ground coffee is packed into various formats (F1–F8), as detailed in Table 5. This packaging process consumes approximately 0.00366 kWh of electricity per kg of ground coffee (Phrommarat, 2019). All electricity for this operation is sourced from the Italian medium-voltage network.
The manufacturing of packaging material involves distinct processes for each type. Flexible laminated bags are produced by bonding plastic, foil, and another plastic layer together using extrusion coating/lamination, where molten polymer acts as an adhesive. After printing and slitting, this composite material undergoes bag-forming (heat sealing the edges), filling with coffee, and finally sealing and cutting.
For aluminum coffee capsules, the cup shape is achieved by pressing aluminum slugs or discs into a die with a punch; these are then trimmed and often lacquered. Multi-layer composite capsules (plastic/aluminum) have their bodies created through injection molding. PLA-based capsules are often co-extruded/laminated with other biopolymers to enhance barrier properties and are formed by injection molding. Paper-based capsules are made by molding/compressing paper pulp.
The lids for all capsule types are prepared through the lamination of either aluminum foils or biodegradable laminates, which are then die-cut. After assembly, all capsules are filled with coffee. They are then nitrogen-flushed to preserve freshness and subsequently heat-sealed. Finally, coffee balls are manufactured by compressing ground coffee into dense spheres. These spheres are then spray coated with a thin, protective, and plant-based layer and subsequently dried before being packaged.
Coffee paper filters, whether for single-use or reusable capsules (RC), are engineered for controlled porosity, high wet strength, and taste neutrality. Their creation starts with selecting raw materials, such as wood pulp or sustainable plant fibers, which undergo pulping to form fiber slurry. This pulp is then mechanically treated to enhance fiber properties, with additives, such as wet strength agents, often incorporated. Bleaching, if done, uses eco-friendly methods. The refined slurry is fed onto a mesh belt for sheet formation, followed by pressing to remove water and drying to solidify the paper. Many filters are then textured to boost filtration efficiency. Finally, large paper rolls are slit and cut into precise shapes, such as circular discs for coffee capsules, which are integrated during automated capsule filling or designed for reusable capsules. All details about the primary, secondary, and tertiary packages used are given in Environmental impact of coffee packaging..
Transportation and distribution stage
Complete transportation throughout the supply chain comprised Euro 5 road vehicles, as detailed in Table 9. This encompassed the transportation of the following:
Table 9. Logistics of input/output materials by EURO 5 road vehicles: transportation routes, vehicle types, load capacities, and distances for materials in the supply chain.
| Input/output materials | From | To | Means of transport | Load capacity (MT) | Distance (km) |
|---|---|---|---|---|---|
| Paper filters | PFG | FG | Heavy rigid truck | 7.5–16 | 850 |
| Multilayer bags, pouches, sticky tape, and PE films | PFG | FG | Heavy rigid truck | 7.5–16 | 300 |
| Cartons, pallet labels | PFG | FG | Heavy rigid truck | 7.5–16 | 50 |
| Pallets | EPMC | FG | Heavy rigid truck | 7.5–16 | 200 |
| Pallets (returned) | DC | EPMC | Heavy rigid truck | 7.5–16 | 800 |
| Palletized coffee | FG | DC | Articulated truck | 16–32 | 1,000 |
| Palletized coffee | DC | SoP | Light-medium rigid truck | 3.5–7.5 | 50 |
| Organic and packaging wastes | FG, CH | WCC | Heavy rigid truck | 7.5–16 | 50 |
Notes: CH: consumer houses; DC: distribution center; EPMC: EPAL wood pallet managing center; FG: factory gate; PFG: packaging factory gate; PoS: point of sale; WCC: waste collection center.
-
Raw packaging materials (e.g., granulates, slugs, and pulp) from their production sites (PS) to the packaging material factory gate (PFG), covering a constant distance of 250 km.
-
Packaging materials from PFG to the main coffee factory gate (FG).
-
Final palletized products from FG to DCs and PoS.
-
EPAL wood pallets between the Euro pallet managings center (EPMC), FG, and DCs.
-
Processing waste from FG and post-consumer organic and packaging wastes from consumer houses to WCCs.
Logistics data were partially sourced from a typical Italian coffee processing plant (Cibelli et al., 2021) and partly from the Product Category Rules for Moka coffee and espresso preparation (EPD, 2019a, 2019b).
Consumer phase
All coffee formats are stored at room temperature. To prepare a 40-mL cup of coffee, the energy requirements were determined as indicated in the category rules for Moka and espresso coffees (EPD, 2019a, 2019b) and detailed in Table 2. Notably, the specific energy consumption per coffee cup, as measured for PE-Al-PET capsules (Format F5) and shown in Table 2, was assumed to be consistent with that associated with the use of other Nespresso®-compatible capsules, such as formats F3, F4, F6, and F7 as well as coffee balls (F8). Electricity energy (EE) was the only energy resource used, which was withdrawn from the Italian low-voltage grid.
For reusable stainless steel capsules, which are designed for more than 1,000 uses because of their high durability, a specialized twisting device precisely fills each capsule with 4.2–5.5 g of ground coffee. This achieves an average fill of 5.2 g while minimizing coffee waste to just 0.1 g per charge. Each capsule includes a silicone gasket and a paper filter, both weighing approximately 0.3 g. Both paper filter and SCGs are suitable for disposal in organic waste stream. For Moka pot and espresso coffee machine preparation, filling of Moka funnel or espresso machine portafilter resulted in a coffee waste of 3% and 2% of ground coffee charge, respectively. In contrast, no coffee waste was assumed for coffee capsules or coffee pods.
To avoid the burden of disposable paper or plastic cups, the beverage was consumed from 120-g earthenware cups. However, to highlight the effect of the different coffee formats used, their washing was not considered to avoid confounding environmental impacts with varying energy classes, load capacities, and washing period of used dishwashers.
Management of coffee processing and packaging waste
As detailed in Environmental impact of coffee waste disposal, all wastage from RGC packaging (based on discarded percentages shown in Table 8) and the post-consumer phase was collected through a differentiated method. These wastes were then disposed of according to Italy’s 2022 municipal solid waste management settings, as outlined in Table 7.
Notably, SCGs were collected as organic waste. This included SCGs separated from Moka funnels, espresso machine portafilters, reusable capsules as well as those contained within the exhausted coffee pads, PLA- or paper-based capsules, and coffee balls. The mass of this organic waste amounted to 2.14 ± 0.2 times the mass of original ground coffee, regardless of the coffee format used (Cibelli et al., 2021). Conversely, Al, PE-Al-PET, and PP capsules were not separated from their SCGs and were disposed of in the undifferentiated fraction of municipal solid waste.
Environmental impact assessment
Environmental impact of the chosen functional unit was estimated using the standard PEF methodology (European Commission, 2018), which is embedded in the SimaPro software (PRé Consultants, Amersfoort, NL). Following a cut-off system model (Ecoinvent, 2024), the producer is held responsible for waste disposal, and no credit is received for the provision of recyclable materials. Therefore, all potential CO2 credits from the recycling of both renewable and nonrenewable materials were excluded.
The PEF method accounts for 16 impact categories, with their reference substances indicated in parentheses: “climate change” (CC: kg CO2e); “ozone depletion” (OD: kg CFC-11e); “ionizing radiation-human health” (IR: kBq 235Ue); “photochemical ozone formation” (PhOF: kg NMVOCe); “particulate matter (PM: disease inc.);” “human toxicity, non-cancer” (NC-HT: CTUh); “human toxicity, cancer” (C-HT: CTUh); “acidification” (AC: mol H+e); “freshwater eutrophication” (FWE: kg Pe); “marine eutrophication” (ME: kg Ne); “terrestrial eutrophication” (TE [mol Ne]); “freshwater eco-toxicity” (FWET: CTUe); “land use” (LU: Pt); “water scarcity” (WU: m3 depriv.); “resource use fossils” (RUF; MJ); and “resource use-mineral and metals” (RUMM [kg Sbe]).
This methodology consolidates these environmental impacts into a single point value. This is achieved by normalizing each impact category against its corresponding global impact, as recommended by Sala et al. (2017). The normalized scores are then weighed according to Sala et al. (2018) and are summed to yield the overall weighed score (PEF).
Sensitivity analysis
To address uncertainties in SCG and packaging waste proportions and resource consumption within the brewing process, a sensitivity analysis was conducted using Monte Carlo simulations. Triangular and/or normal probability distributions were assigned to relevant parameters in the LCA model. Employing the SimaPro software, 2,000 iterations were performed, generating random variables within these defined uncertainty ranges. This process recalculated impact categories and the overall score, resulting in a probability distribution of potential outcomes that comprehensively assess the study’s inherent uncertainty. Tukey’s Honestly Significant Difference (HSD) test (p < 0.05) was subsequently applied to evaluate the statistical significance of differences observed among parameters.
Results and Discussion
Waste mass balances and packaging material discards for diverse coffee formats
Table 10 provides a detailed mass balance of waste generated when a net amount of 720 kg of RGC is packed for eight different coffee packaging formats, designated F1–F8. This analysis incorporates the proportions of raw material and packaging materials discarded at industrial roaster scale, as detailed in Table 8. All wastage and material discards are presented in kg, as indicated in the “Unit” column.
Table 10. Waste mass balances and packaging material discards for the eight coffee packaging formats described in Table 5 when packing a net amount of 720 kg of roasted and ground coffee (RGC).
| Coffee formats Parameter | F1 | F2 | F3 | F4 | F5 | F6 | F7 | F8 | Unit |
|---|---|---|---|---|---|---|---|---|---|
| RGC | 722.16 | 722.16 | 722.16 | 722.16 | 722.16 | 722.16 | 722.16 | 722.16 | kg |
| Wood waste | 0.03 | 0.18 | 0.07 | 0.07 | 0.07 | 0.07 | 0.07 | 0.10 | kg |
| Paper and cardboard waste | 46.2 | 482.8 | 239.3 | 239.4 | 228.7 | 239.4 | 242.8 | 283.4 | kg |
| Plastic waste | 5.1 | 6.7 | 3.0 | 6.9 | 2.9 | 3.0 | 3.0 | 4.2 | kg |
| Bag or capsule waste | 23.0 | 151.3 | 200.3 | 462.1 | 146.6 | 343.8 | 340.4 | 0.0 | kg |
| SCGs | 1,538.8 | 1,538.8 | 1,538.8 | 1,538.8 | 1,538.8 | 1,538.8 | 1,538.8 | 1,538.8 | kg |
| Organic waste | 2.16 | 2.16 | 2.16 | 2.16 | 2.16 | 2.16 | 2.16 | 2.16 | kg |
| Compostable waste | 0.00 | 17.93 | 0.00 | 0.00 | 0.00 | 78.9 | 78.9 | 38.8 | kg |
| Aluminum waste | 0.00 | 0.00 | 1.64 | 0.33 | 0.14 | 0.00 | 0.00 | 0.0 | kg |
| N2Emissions to Air | 0.00 | 0.00 | 56.3 | 56.3 | 53.8 | 56.3 | 56.3 | 0.0 | kg |
| Overall wastes formed | 1,615.3 | 2,199.9 | 1,985.3 | 2,249.8 | 1,919.2 | 2,206.2 | 2,206.2 | 1,867.5 | kg |
| Overall packaging wastes formed | 74.3 | 658.9 | 444.3 | 708.8 | 378.3 | 665.2 | 665.2 | 326.6 | kg |
| Packaging materials–RGC ratio | 0.103 | 0.915 | 0.617 | 0.984 | 0.525 | 0.924 | 0.924 | 0.454 | kg/kg |
Consistently, SCGs represent the largest single waste component across all formats, contributing approximately 1,538.8 kg, which translates to about 2.1 kg/kg of RGC.
Regarding packaging of waste components, paper and cardboard waste represents a major contribution, particularly for most capsule and pad formats. Coffee pads (F2) lead significantly with 482.8 kg, followed by coffee balls (F8) at 283.4 kg. Various capsule formats (F3, F4, F5, F6, and F7) show contributions ranging from 228.7 kg to 239.4 kg. In contrast, coffee flexible multilayer bags (F1) generate a significantly lower amount at 46.2 kg.
Regarding plastic waste, coffee PP capsules (F4) afforded rise to the highest amount at 6.9 kg, followed closely by coffee pads (F2) at 6.7 kg. Coffee balls (F8) contributed 4.2 kg of plastic waste. Other capsule types, such as F3, F5, F6, and F7, generate notably lower plastic waste, typically around 2.9–3.0 kg. Coffee flexible multilayer bags (F1) were responsible for 5.1 kg of plastic waste.
The “Bag or Capsule waste” category specifically reflects the mass of primary packaging unit discarded. Coffee PP capsules (F4) show the highest contribution at 462.1 kg, followed by PBS/PLA (F6) at 343.8 kg and paper-based (F7) capsules at 340.4 kg. Other capsule types, such as F3 (200.3 kg) and F5 (146.6 kg), also showed substantial contributions, as do pads (F2) at 151.3 kg. Interestingly, coffee balls (F8) have no contribution to this category, as their primary packaging waste is classified as compostable waste. Even in this category, coffee flexible multilayer bags (F1) have a significantly lower amount at 23.0 kg.
Aluminum waste primarily derives from Al capsules (F3) at 1.64 kg, while formats incorporating aluminum lids, such as F4 (0.33 kg) and F5 (0.14 kg), report smaller amounts of aluminum waste. Formats F1, F2, and F8 generate no aluminum waste in this context.
Regarding the compostable waste category, PBS/PLA (F6) and paper-based (F7) capsules show a significant amount of compostable waste at 78.9 kg each. They are followed by coffee balls (F8) at 38.8 kg and coffee pads (F2) at 17.9 kg, which is attributable to their paper filter and biopolymer film coating, respectively.
Small amounts of wood waste (ranging from 0.03 kg to 0.18 kg) and organic waste (2.16 kg for all formats) are also reported, although they are minor contributors compared to other categories.
Nitrogen (N2) emissions to air are noted for several capsule types (F3–F7), ranging from 53.8 kg to 56.3 kg, indicating emissions associated with their use phase.
When considering the “overall packaging wastes formed,” the total weight of packaging materials discarded per 720 kg of RGC is maximum in the case of coffee PP capsules (F4) at 708.8 kg. This is followed by PBS/PLA (F6) and paper-based capsules (F7), both at 665.2 kg, and coffee pads (F2) at 658.9 kg. Aluminum (F3) and PE-Al-PET (F5) capsules contribute 444.3 kg and 378.3 kg of packaging waste, respectively. Coffee balls (F8) have a lower amount of waste at 326.6 kg, although the lowest overall packaging waste, at just 74.3 kg, is associated with coffee flexible multilayer bags (F1).
In conclusion, the following key observations are pointed out:
-
Single-serve formats (pads and capsules) generally generate substantially more packaging waste per kg of RGC, compared to flexible multilayer bags (F1) and coffee balls (F8).
-
Coffee flexible multilayer bags (F1) consistently demonstrate the lowest environmental burden from packaging waste across all metrics as shown in Table10.
-
Coffee PP capsules (F4) resulted in the highest packaging materials–RGC ratio (0.984 kg/kg), followed by compostable capsules (F6 and F7) at 0.924 kg/kg each, and coffee pads (F2) at 0.915 kg/kg.
-
High figures for “bag or capsule waste” for most capsule/pad formats confirm that the discarded primary packaging units account for a substantial portion of their overall waste mass.
-
The presence of compostable waste in F2 and F6–F8 formats indicates a shift toward more sustainable material choices in these formats, although these still exhibit higher overall packaging waste compared to flexible bag (F1).
Environmental profile for diverse coffee formats and brewing systems
To remove the variability associated with coffee variety, cultivation, and initial processing, the same RGC was used across all formats and brewing systems examined here to primarily attribute any differences in PEF scores and impact category contributions to the following:
-
Production, transport, and end-of-life of packaging materials (i.e., bags, pads, and capsules).
-
Use-phase energy of the brewing machines used (e.g., Moka pot, espresso, and pad/capsule machine).
-
Energy and water consumed during the actual brewing of a single cup.
-
Easiness/difficulty to separate and dispose of SCGs and packaging.
Table 11 presents normalized and weighed impact categories (expressed in mPt) according to the PEF standard method, along with the overall weighed PEF score, for eight coffee formats (F1–F8) described in Table 5 across various brewing systems, when referring to a functional unit of 720 kg of packed RGC. The brewing systems included Moka pot, espresso machine, pad/capsule coffee machines, and reusable capsules for a typical capsule coffee machine.
Table 11. Normalized and weighed impact categories (IC) and the overall weighed score (PEF) according to the PEF standard method for various coffee formats (F1–F8) described in Table 5 and associated brewing systems, as referred to a functional unit of 720-kg of packed roasted and ground coffee (RGC).
| Coffeeformat | F1 MLB | F2 CPO | F3 AlC | F4 PPC | F5 PAPC | F6 CP | F7 PC | F8 CB | ||||||||||||
|---|---|---|---|---|---|---|---|---|---|---|---|---|---|---|---|---|---|---|---|---|
| Brew. system | MP | ECM | RC | PCM | CCM | CBM | ||||||||||||||
| IC (mPt) | M±SD | % | M±SD | % | M±SD | % | M±SD | % | M±SD | % | M±SD | % | M±SD | % | M±SD | % | M±SD | % | M±SD | % |
| CC | 26.5±0.5 | 32.0 | 30.8±0.2 | 32.3 | 31.4±1.3 | 31.8 | 74.8±2.4 | 26.0 | 117.1±1.4 | 41.4 | 148.8±1.5 | 40.9 | 111.3±0.7 | 46.5 | 110.3±1.5 | 34.8 | 95.7±1.0 | 35.9 | 85.8±1.6 | 39.8 |
| OD | 0.0±0.0 | 0.0 | 0.0±0.0 | 0.0 | 0.0±0.0 | 0.0 | 0.4±0.1 | 0.1 | 0.0±0.0 | 0.0 | 0.0±0.0 | 0.0 | 0.3±0.0 | 0.1 | 0.1±0.0 | 0.0 | 0.0±0.0 | 0.0 | 0.1±0.0 | 0.0 |
| IR | 0.7±0.0 | 0.9 | 0.9±0.0 | 1.0 | 0.9±0.0 | 0.9 | 2.1±0.0 | 0.7 | 1.3±0.0 | 0.5 | 3.5±0.0 | 1.0 | 1.8±0.0 | 0.8 | 4.2±0.1 | 1.3 | 2.4±0.0 | 0.9 | 1.3±0.0 | 0.6 |
| PhOF | 3.3±0.0 | 4.0 | 3.8±0.0 | 4.0 | 3.9±0.1 | 4.0 | 9.8±0.4 | 3.4 | 8.8±0.1 | 3.1 | 11.9±0.1 | 3.3 | 7.9±0.0 | 3.3 | 12.1±0.2 | 3.8 | 9.6±0.1 | 3.6 | 17.3±0.5 | 8.0 |
| PM | 6.0±0.1 | 7.3 | 6.5±0.0 | 6.9 | 6.8±0.2 | 6.9 | 24.1±2.8 | 8.3 | 14.9±0.1 | 5.3 | 20.2±0.1 | 5.6 | 12.4±0.1 | 5.2 | 20.8±0.3 | 6.6 | 18.3±0.2 | 6.8 | 12.7±0.2 | 5.9 |
| AC | 4.7±0.1 | 5.6 | 5.4±0.0 | 5.7 | 5.6±0.3 | 5.7 | 14.3±2.4 | 5.0 | 8.7±0.1 | 3.1 | 12.8±0.1 | 3.5 | 6.9±0.0 | 2.9 | 15.1±0.3 | 4.8 | 11.0±0.2 | 4.1 | 7.6±0.1 | 3.5 |
| FWE | 2.8±0.1 | 3.4 | 3.4±0.0 | 3.6 | 4.1±0.2 | 4.1 | 21.8±8.6 | 7.6 | 11.4±0.1 | 4.0 | 17.1±0.2 | 4.7 | 5.1±0.0 | 2.1 | 13.4±0.4 | 4.2 | 16.5±0.5 | 6.2 | 3.9±0.1 | 1.8 |
| ME | 1.8±0.0 | 2.2 | 2.0±0.0 | 2.1 | 2.1±0.1 | 2.1 | 8.5±1.8 | 3.0 | 7.3±0.1 | 2.6 | 8.5±0.1 | 2.3 | 5.5±0.0 | 2.3 | 8.4±0.1 | 2.7 | 7.6±0.1 | 2.9 | 6.3±0.1 | 2.9 |
| TE | 2.7±0.1 | 3.3 | 3.0±0.0 | 3.2 | 3.2±0.1 | 3.2 | 9.1±2.0 | 3.1 | 5.2±0.0 | 1.8 | 6.8±0.0 | 1.9 | 3.4±0.0 | 1.4 | 7.7±0.2 | 2.4 | 6.4±0.1 | 2.4 | 4.3±0.1 | 2.0 |
| FWET | 3.6±0.1 | 4.3 | 3.9±0.0 | 4.1 | 4.1±0.2 | 4.1 | 9.4±2.4 | 3.3 | 7.0±0.1 | 2.5 | 7.7±0.1 | 2.1 | 4.9±0.0 | 2.1 | 11.3±0.2 | 3.6 | 8.8±0.1 | 3.3 | 6.7±0.1 | 3.1 |
| C-HT | 0.4±0.0 | 0.5 | 0.5±0.0 | 0.5 | 0.5±0.0 | 0.5 | 0.5±1.8 | 0.2 | 0.8±0.0 | 0.3 | 1.0±0.0 | 0.3 | 0.9±0.0 | 0.4 | 1.4±0.0 | 0.4 | 1.1±0.0 | 0.4 | 0.8±0.0 | 0.4 |
| NC-HT | 1.5±0.0 | 1.8 | 1.8±0.0 | 1.8 | 1.8±0.1 | 1.8 | –0.9±48.2 | –0.3 | 3.0±0.1 | 1.1 | 3.1±0.1 | 0.9 | 3.7±0.0 | 1.5 | 4.8±0.1 | 1.5 | 3.8±0.1 | 1.4 | 2.9±0.0 | 1.4 |
| LU | 0.5±0.0 | 0.6 | 0.5±0.0 | 0.6 | 0.9±0.0 | 0.9 | 2.8±0.6 | 1.0 | 1.6±0.0 | 0.6 | 2.5±0.0 | 0.7 | 1.2±0.0 | 0.5 | 2.7±0.1 | 0.8 | 7.6±0.3 | 2.9 | 1.1±0.0 | 0.5 |
| WU | 7.9±0.1 | 9.5 | 7.7±0.1 | 8.1 | 8.6±0.3 | 8.8 | 54.8±6.3 | 19.0 | 60.2±1.2 | 21.3 | 35.7±0.2 | 9.8 | 29.5±0.2 | 12.3 | 30.4±0.3 | 9.6 | 31.0±0.3 | 11.6 | 29.2±0.6 | 13.6 |
| RUF | 14.5±0.2 | 17.6 | 17.3±0.1 | 18.1 | 17.3±0.6 | 17.6 | 45.3±0.8 | 15.7 | 27.7±0.3 | 9.8 | 70.3±0.7 | 19.3 | 35.0±0.2 | 14.6 | 56.6±1.4 | 17.9 | 36.3±0.5 | 13.6 | 26.7±0.3 | 12.4 |
| RUMM | 5.9±0.1 | 7.1 | 7.7±0.1 | 8.1 | 7.6±0.4 | 7.7 | 11.5±0.6 | 4.0 | 8.2±0.2 | 2.9 | 13.5±0.2 | 3.7 | 9.3±0.1 | 3.9 | 17.3±0.4 | 5.5 | 10.6±0.2 | 4.0 | 8.7±0.2 | 4.0 |
| PEF | 83±1 | 100.0 | 95±1 | 100.0 | 99±4 | 100.0 | 288±58 | 100.0 | 283±3 | 100.0 | 363±3 | 100.0 | 239±1 | 100.0 | 317±6 | 100.0 | 267±4 | 100.0 | 215±3 | 100.0 |
Notes: Coffee formats: AlC: Al capsules; CB: coffee balls; CP: PBS/PLA capsules; CPO: coffee pads; MLB: multi-layer bags; PAPC: PE-Al-PET capsules; PC: paper-based capsules; PP: polypropylene; PPC: PP capsules.
Brewing systems: CBM: coffee ball machine; CCM: capsule coffee machine; ECM: espresso coffee machine; MP: Moka pot; PCM: pad coffee machine; RC: reusable capsules.
Foremost, from the analysis of PEF scores, it was clear that F1 (multi-layer bags) brewed with Moka pot had the lowest environmental impact with a score of 83 mPt. This was probably due to the simplicity of the brewing device, lower use-phase energy consumption per cup, compared to automated machines (Table 2), and the packaging format (multi-layer bags), which, while not zero-waste, was less resource-intensive than single-serve capsules. Espresso machine exhibited a slightly higher impact (95 mPt), staying very close to Moka pot. This might be attributed to the higher use-phase energy consumption per cup of espresso machine and higher ground coffee used per single brewing cycle (Table 2).
Use of reusable capsules filled with ground coffee packed in multi-laminated bags (F1) displayed a slightly higher impact (99 mPt) than Moka pot and espresso machine. This could be due to the higher use-phase energy consumption per cup of a typical capsule machine (Table 2), which might have higher standby power or operational energy than a Moka pot, as well as the use of paper filters that are disposed of in organic waste together with SCGs. In this study, the energy associated with cleaning reusable capsules, as well as the manufacturing impact of reusable capsule themselves over their lifetime of more than 1,000 reuses, were disregarded. Although user cleaning practices were ignored in all the brewing systems examined here, it is critical to note that capsule’s actual lifespan in consumer hands could alter the environmental profile of reusable capsules.
Thus, the traditional brewing methods (Moka pot and espresso machine) using ground coffee from multi-layer bags (F1) consistently show significantly lower environmental impacts, compared to all capsule- and pad-based systems. Moreover, formats F2–F8 generally show significantly higher environmental impacts, compared to format F1 with traditional brewing methods. The primary reasons for this higher impact are typically as follows:
-
Packaging material production: The resources and energy required to produce individual pads/capsules (aluminum, PP, PE-Al-PET, PBS/PLA, paper-based, and coffee balls).
-
End-of-life impact: Disposal of single-use capsules/pads, especially those that cannot be easily separated from SCGs (e.g., Al, PP, and PE-Al-PET capsules) and thus are difficult to recycle. This also underscores that the effectiveness of the existing waste management and recycling infrastructure plays a critical role in realizing the theoretical environmental benefits of various materials.
-
Energy consumption of pad/capsule machines, which often have higher standby power consumption and may be less energy-efficient per cup compared to Moka pots (Table 2).
It is also worth noting that format F5 (i.e., PE-Al-PET capsules) emerged as the one with the “best” environmental performance among single-serve options. Its PEF score was 239 mPt, despite being considerably higher than F1 traditional methods. This was probably due to its lower capsule mass with respect to other PP (F4) or compostable (F6 and F7) capsules and the absence of a paper-based filter, which was generally used in the other capsules (F3–F4 and F6–F7). This suggests that these design choices effectively mitigate some material-related impacts, allowing other factors, such as machine energy, to dominate.
In spite of the Quantis report (Dubois et al., 2011), Al capsules (F3) exhibited a greater environmental impact (283 mPt) than that of multi-laminated ones (F5) (239 mPt), probably because of their greater aluminum content. In fact, both were disposed of as undifferentiated waste, the SCGs and paper-based filters being generally unseparated from capsules and lids.
The recent paper-based capsules (F7) showed a lower PEF (267 mPt), compared to aluminum capsules, probably because paper is biodegradable/compostable and does not need to be separated from SCGs. This finding aligns with the Quantis’ (2024) report.
Other compostable PBS/PLA capsules (F6) exhibited a higher impact (317 mPt) than PE-Al-PET and paper-based capsules, thus highlighting that “bio-base” does not automatically mean low impact, as processing and end-of-life pathways for these materials are still resource-intensive. This demonstrates a common challenge in sustainable design, where attempts to mitigate one environmental problem (e.g., material waste through bio-based plastics) can shift burdens to other impact categories, such as CC or RUF, because of energy-intensive production processes.
Despite being a better option than most capsules, coffee pads (F2) still register a substantial environmental impact (288 mPt). This is largely due to the necessity of protective multilayer pouches, which contribute to undifferentiated waste, and the energy consumed by pad machine during use. Variability, quantified by a coefficient of variation (i.e., standard deviation-to-mean ratio) of approximately 20%, was observed, which is linked to the high discard fraction of paper filter in industrial settings (Cibelli et al., 2021).
Surprisingly, coffee balls (F8) emerged as the best-performing single-serve option, even surpassing F5 by a small margin. This indicates that their compostable nature and lower material requirements contribute to a significantly reduced PEF, compared to traditional plastic or aluminum capsules, as well as novel compostable capsules.
In conclusion, among the single-serve options, coffee balls (F8) and PE-Al-PET capsules (F5) appeared to be better choices, although they still had a higher impact than Moka Pot or espresso machine with the coffee format F1.
Given the standardization of RGC, climate change (CC) and fossil resource use (RUF) were key categories, reflecting energy consumption and material intensity, and proved prominent in differentiating the formats examined.
In the case of multi-layer bags (F1) used with Moka pot, espresso machine, and capsule machine with reusable capsules, climate change and RUF were the dominant factors, representing approximately 32% and 17% of the overall weighed score (PEF), respectively. The primary factor (climate change) was mainly driven by the use-phase energy consumed during brewing and the production/end-of-life of multi-layer bags, while the secondary one (RUF) reflected the fossil resources used for bag production, as well as the paper filters used with reusable capsules, and energy generation.
For coffee pads (F2), climate change, water use (WU), and RUF represented as much as 26%, 19%, and 15.7% of PEF, respectively. The significant contribution of WU was attributable to water consumption for producing coffee pads (e.g., paper or non-woven materials). The packaging (pads and their protective pouches) and pad machine energy demands are also primary drivers for the overall impact.
For aluminum capsules (F3), climate change and WU were the main factors, contributing 41.4% and 21.3% of PEF, respectively. This was unequivocally linked to the manufacturing of aluminum capsules and their associated production processes (e.g., bauxite extraction for aluminum).
For PP capsules (F4), climate change was still the top contributor (40.9% of PEF), but RUF remained very high (19.3%). This highlighted that the production of PP capsules was highly dependent on fossil resources, and the energy for their manufacturing, combined with the machine’s use-phase energy, drove the impact of climate change.
For multi-laminated capsules (F5), climate change and RUF represented 46.5% and 14.6% of PEF, respectively. This high contribution of climate change was strongly linked to the use-phase energy consumption of capsule machine and the manufacturing processes of PE-Al-PET multi-layer capsule, despite its potentially lower mass. RUF reflected plastic components and energy.
For PBS/PLA capsules (F6), climate change and RUF were the highest contributors (34.8% vs. 17.9%) because of the energy and resources used in their production processes. Moreover, WU stood out as the third factor (9.6%), probably because of the raw material cultivation or processing of bioplastics. Similarly, for paper-based capsules (F7), climate change led the impact (35.9% of PEF), with RUF (13.6%) and WU (11.6%) also having significant impact. The impact here was primarily from the energy used in the poly-lactate and pulp–paper manufacturing process for capsules and the use-phase energy consumption of capsule machine. Their compostable nature minimized some material impacts but shifted the focus to manufacturing energy.
Finally, for coffee balls (F8), climate change was the largest contributor (39.8% of PEF), followed by WU (13.6%) and RUF (12.4%). The greater contribution of WU, compared to RUF, could stem from water demands in the biopolymer production process for coffee balls, while the reduced and simpler packaging material lowered RUF.
In essence, by standardizing the coffee’s upstream impact, the analysis clearly highlights that the choice of packaging material (especially its production energy and resource intensity) and energy consumption during the brewing phase are the primary determinants of PEF differences between coffee formats and brewing systems. For formats such as F1 (multi-layer bags) and F8 (coffee balls), where the packaging is either relatively simple or minimized, climate change is the primary driver (e.g., 32.0% for Moka pot (F1), and 39.8% for F8). This suggests that for these systems, the use-phase energy consumed by the brewing machine is the most significant differentiating factor, combined with the basic impact of packaging material production.
Granular environmental footprint: per-cup analysis of waste and key impacts
As indicated by the overall PEF scores in Table 11, traditional coffee preparation methods generally offer substantial environmental advantages. To provide a more granular and actionable understanding of these differences—particularly concerning waste generation and specific environmental burdens—a detailed per-cup analysis was conducted. This approach directly quantifies the environmental performance of each coffee format at the individual consumption level, aligning with stringent waste reduction and circularity objectives, such as those outlined in regulations like the PPWR.
Table 12 presents the specific mass of organic waste (SCGs) and packaging waste generated per single coffee cup for each of the eight examined formats. Furthermore, it details the per-cup contributions to the most significant environmental impact categories, including climate change, RUF, and WU, along the overall PEF.
Table 12. Specific mass of organic waste (SCGs and ground coffee waste) and packaging waste impacting environmental impact categories (CC, RUF, RUMM, and WU), and the overall weighed score (PEF) associated with the preparation of a single cup of coffee using different coffee formats and brewing systems.
| Coffee format | F1 MLB | F2 CPO | F3 AlC | F4 PPC | F5 PAPC | F6 CC | F7 PC | F8 CB | Unit | ||
|---|---|---|---|---|---|---|---|---|---|---|---|
| Brewing system | MP | ECM | RC | PCM | CCM | CBM | |||||
| RGC | 5.34 | 9.00 | 5.2 | 7.23 | 5.50 | 5.50 | 5.75 | 5.50 | 5.50 | 5.60 | g/cup |
| Wood waste | 0.0002 | 0.002 | 0.001 | 0.001 | 0.001 | 0.001 | 0.001 | 0.001 | g/cup | ||
| Paper and cardboard waste | 0.343 | 4.849 | 1.828 | 1.829 | 1.826 | 1.829 | 1.855 | 2.204 | g/cup | ||
| Plastic waste | 0.038 | 0.067 | 0.023 | 0.053 | 0.023 | 0.023 | 0.023 | 0.033 | g/cup | ||
| Bag/capsule waste | 0.170 | 1.520 | 1.530 | 3.530 | 1.171 | 2.626 | 2.600 | 0.000 | g/cup | ||
| Organic waste | 11.42 | 15.47 | 11.77 | 11.77 | 12.31 | 11.77 | 11.77 | 11.99 | g/cup | ||
| Compostable waste | - | - | - | - | - | 0.603 | 0.603 | 0.302 | g/cup | ||
| Aluminum waste | 0.000 | 0.000 | 0.013 | 0.003 | 0.001 | 0.000 | 0.000 | 0.000 | g/cup | ||
| Overall waste formed | 11.97 | 22.09 | 15.17 | 17.19 | 15.33 | 16.85 | 16.853 | 14.525 | g/cup | ||
| PM/RGC | 0.551 | 6.617 | 3.394 | 5.415 | 3.021 | 5.081 | 5.081 | 2.540 | g/cup | ||
| CCcup | 8.2±0.1 | 13.8±0.1 | 8.1±0.3 | 27±1 | 32.1±0.4 | 40.8±0.4 | 31.9±0.2 | 30.2±0.4 | 26.2±0.3 | 23.9±0.4 | kg CO2e/cup |
| RUFcup | 100±1 | 169±1 | 98±4 | 355±7 | 165±2 | 419±4 | 218±1 | 338±8 | 217±3 | 162±2 | kJ/cup |
| WUcup | 7.7±0.1 | 13.0±0.1 | 8.4±0.3 | 74±9 | 62±1 | 36.7±0.2 | 31.7±0.2 | 31.3±0.3 | 31.9±0.3 | 31±1 | L depriv./cup |
| PEFcup | 613±10 | 1,191±9 | 713±29 | 2,895±581 | 2,162±23 | 2,777±23 | 1,910±10 | 2,419±42 | 2,038±27 | 1,675±25 | nPt/cup |
AlC: AI capsule; CB: coffee balls; CBM: coffee ball machine; CC: PBS/PLA capsules; CCcup: climate change per single coffee cup (kg CO2e/cup); CCM: coffee capsule machine; CPO: coffee pad; ECM: espresso coffee machine; MLB: multi-layer bags; MP: Moka pot; PAPC: PE-Al-PET capsule; PC: paper-based capsule; PCM: pad coffee machine; PEFcup: product environmental footprint per single coffee cup (nPt/cup); PPC: PP capsule; RC: reusable capsules; RUFcup: fossil resource use per single coffee cup (kJ/cup); WUcup: water use per single coffee cup (L depriv./cup).
Spent coffee grounds consistently constituted the largest waste component across all coffee formats and brewing methods, irrespective of coffee waste during filling for Moka pot, espresso coffee machine, and reusable capsules. Their amount ranged from 11.4 g/cup for multi-layer bags (F1) brewed with a Moka pot to 15.5 g/cup for coffee pads (F2).
Analysis of packaging waste revealed significant differences. While multi-layer bags with a Moka pot exhibited very low values for paper/cardboard (0.34 g/cup) and plastic waste (0.038 g/cup), all other capsule and pad systems (F2–F7), and even coffee balls (F8), showed substantially higher amounts, ranging from 1.83 g/cup to 4.85 g/cup for paper/cardboard, and from 0.023 g/cup to 0.067 g/cup for plastic.
Bag/capsule waste was nil for coffee balls (F8), reflecting their innovative design, but was present for F1 at a low of 0.17 g/cup. All capsule formats, specifically PE-Al-PET capsules (F5) and PP capsules (F4), contributed significantly, with bag/capsule waste ranging from 1.17 g/cup to 3.53 g/cup. This waste was typically disposed of in undifferentiated stream for formats such as Al capsules (F3), PP capsules (F4), and PE-Al-PET capsules (F5), or the organic stream for PSB/PLA capsules (F6) and paper-based capsules (F7). Compostable waste included the lids and filters for PSB/PLA capsules (F6) and paper-based capsules (F7), or the biopolymer coating for coffee balls (F8). Finally, aluminum waste was primarily associated with Al capsules (F3) and their lids (0.013 g/cup), with smaller amounts attributed to Al lids discarded from PP capsules (F4) and PE-Al-PET capsules (F5) (0.003 g/cup).
Overall, the total waste formed was minimal for multi-layer bags (F1) at approximately 12 g/cup. This value increased to 14.5 g/cup for coffee balls (F8) and reached a maximum of 22.1 g/cup for coffee pads (F2), largely driven by their associated packaging.
The GHG emissions per single coffee cup varied significantly. The lowest emissions were observed when using multi-layer bags with a Moka pot (8.2 g CO2e/cup). This increased to approximately 24 g CO2e/cup for coffee balls (F8) with CBM. Different capsule formats (F3–F7) exhibited higher emissions, ranging from 26 g CO2e/cup to 41 g CO2e/cup, with maximum emission attributed to PP capsules. Similar trends were observed for specific fossil resource use (RUFcup) and water use per single coffee cup (WUcup). These categories ranged from 100 kJ/cup and 7.7 L deprived/cup for multi-layer bags with a Moka pot to 162 kJ/cup and 31 L deprived/cup for coffee balls (F8), reaching up to 419 kJ/cup for PP capsules (F4) and 75 L deprived/cup for coffee pads (F2).
Finally, the overall weighed score per single coffee cup (PEFcup) provided a holistic view of environmental impact. Multi-layer bags (F1) with a Mokapot (613±10 nPt/cup) and coffee balls (1,675±25nPt/cup) demonstrated the best overall environmental performance. All capsule and pad systems, particularly coffee pads (2,895±581 nPt/cup) and PP capsules (2,777±23 nPt/cup), showed significantly higher PEF scores, indicating a greater overall environmental burden. This was largely attributable to the substantial amount of single-use packaging materials (plastic, aluminum, and paper/cardboard) and the energy and resources consumed in their production and disposal. Notably, PP capsules and coffee pads exhibited particularly high fossil resource use and the overall weighed scores.
In conclusion, for those prioritizing environmental sustainability in their coffee choices, selecting ground coffee (such as those used with MLB in a Moka pot) or innovative coffee balls offers a significantly more environment-friendly alternative, compared to various coffee capsule and pad systems. Table 12 allows for a direct comparison of tangible impacts associated with a single serving of coffee, offering crucial insights for both consumers seeking more sustainable choices and industry stakeholders aiming for environmentally optimized product design.
Limitations of the Study
While this study provides valuable insights into the PEF of various coffee formats, it is important to acknowledge certain limitations that delineate its scope and inform the interpretation of its findings:
-
Trade-off between environmental impact and consumer convenience: The observed superior environmental performance of traditional brewing systems, such as Moka pots and espresso machines utilizing ground coffee from multilayer bags, or even reusable capsules, often comes at the expense of increased consumer effort. These methods typically demand more active engagement from the consumer, involving steps such as precise filling of portafilter or reusable capsule with ground coffee, and the manual disposal of SCGs into organic waste stream. In contrast, single-serving systems, despite their higher PEF, offer unparalleled convenience, a factor that significantly contributes to their rapidly increasing market share. This highlights a key challenge in promoting sustainable consumption—effectively balancing environmental responsibility with prevailing consumer preferences for ease of use.
-
Impact of a single RGC variety: The choice to utilize a single RGC variety inherently influences the impact associated with coffee waste generated during the filling of portafilters for Moka pots, espresso machines, and reusable capsules. Different grind sizes or variations in coffee density could potentially alter the quantity or characteristics of this specific waste stream.
-
Variability in energy consumption: Specific energy consumption per cup can be significantly influenced by consumer behavior. Examples include the promptness with which a user switches off an electric stove used to heat a Moka pot, or inherent variations in machine efficiency and individual usage patterns for electric brewing systems. These behavioral aspects introduce a degree of variability not fully captured.
-
Dependency on national electricity grids: The environmental impact associated with electricity consumption for brewing is directly tied to the specific energy mix of the national electricity grid where the coffee is prepared. This study utilized the Italian electricity mix; consequently, regional or national variations in energy sources could alter the overall environmental profile of consumption phase.
-
Scope of the streamlined LCA: This study employed a streamlined LCA methodology, focusing specifically on the use and post-consumer phases of coffee consumption. While this targeted scope was deliberately chosen to align with the PPWR’s emphasis on packaging and end-of-life considerations, a comprehensive cradle-to-grave LCA would provide a more holistic understanding by including the upstream agricultural, processing, and transportation phases of coffee production and packaging manufacturing.
Conclusion and the Future Outlook
This study successfully characterized the fundamentals of coffee production and consumption, along with their associated environmental impacts, through a streamlined LCA focusing on the use and post-consumer phases of various coffee formats. This targeted assessment was motivated by the PPWR’s emphasis on waste reduction and circularity, the escalating environmental burden of single-serve coffee packaging, and the imperative for consistent environmental impact comparisons.
This investigation across eight distinct coffee formats—flexible multilayer bags, pads, and several capsule types (Al, PP, PE-Al-PET, polylactate, and paper), along with innovative coffee balls—and their associated brewing systems (Moka pot, espresso machine, pad/capsule machines, and reusable capsules) yielded significant insights. Employing a functional unit of 720 kg of RGC, the streamlined LCA, assessed with the EU’s PEF methodology, unequivocally demonstrated that traditional brewing systems utilizing ground coffee from multilayer bags were by far less impactful than coffee balls and all single-serving capsules.
This finding, consistently supported by the normalized and weighed impact categories and the overall weighed PEF score (Table 11), underscores the substantial environmental benefits of traditional coffee preparation. For instance, multilayer bags with a Moka pot yielded a PEF score of 613±10 nPt/cup, significantly lower than coffee balls (1,675±25 nPt/cup) and dramatically less than coffee pads (2,895±581 nPt/cup) and PP capsules (2,777±23 nPt/cup).
To provide more granular and actionable insights, Table 12 meticulously details the specific organic and packaging waste per single coffee cup, beside quantifying associated climate change (carbon footprint), fossil resource use, and water use impacts. This direct quantification per serving powerfully illustrates the disproportionate environmental burden, particularly from single-serve systems. For example, the overall waste formed for multilayer bags was about 12 g/cup, rising to 14.5 g/cup for coffee balls, but reaching 22.1 g/cup for coffee pads. Similarly, GHG emissions ranged from 8.2 g CO2e/cup for multilayer bags to 24 g CO2e/cup for coffee balls, and between 26 g CO2e/cup and 41 g CO2e/cup for various capsules, with PP capsules being the highest GHG discharger. This granular data directly support the PPWR’s focus on minimization of packaging waste, making results highly tangible for policymakers and consumers.
Despite the acknowledged limitations and inherent convenience factor offered by single-serve systems, this study effectively identifies crucial environmental hotspots within the coffee consumption life cycle, consistently highlighting the disproportionate impact of single-serve coffee formats.
The findings provide a strong evidence-based foundation for recommendations aimed at aligning coffee consumption practices and product design with the EU’s evolving regulatory framework, thereby promoting more sustainable choices for both consumers and the industry. Moving forward, continued research focusing on innovative packaging materials, strategies for consumer behavior change, and optimized recycling infrastructure are crucial in further mitigating the environmental footprint of coffee consumption, ultimately aiming to bridge the gap between environmental responsibility and consumer convenience.
Acknowledgements
None.
Author Contributions
Both authors contributed equally to this article.
Competing Interests
The authors had no relevant financial interests to disclose.
Conflicts of Interest
The authors declare no conflicts of interest.
Funding
This research was supported by the Consorzio Universitario di Economia Industriale e Manageriale (CUEIM), Verona, Italy, in the research project entitled “Innovation in the world of single-portion coffee – coffee PADS,” special grant POR CALABRIA FESR-FSE 2014-2020.
REFERENCES
AFPAK. n.d. Empty Nespresso capsules for Nespresso machines. https://www.afpkg.com/empty-nespresso-capsules/ (Accessed on: 10 June 2025).
Agenzia Giornalistica Italia (AGI). 2016. Italiani popolo della moka, 97% non rinuncia al caffè. www.agi.it/lifestyle/italiani_popolo_della_moka_97_non_rinuncia_al_caff-1125142/news/2016-09-30/ (Accessed on: 27 May 2025).
Ahmed, Md. W., Haque, Md. A-., Mohibbullah, Md., Islam Khan, Md. S., Islam, M.A., Tarek Mondal, Md. H., and Ahmmed, R. 2022. A review on active packaging for quality and safety of foods: current trends, applications, prospects and challenges. Food Pack Shelf Life. 33:100913. 10.1016/j.fpsl.2022.100913
Almeida J., Le Pellec M., and Bengtsson J. 2018. Reusable coffee cups life cycle assessment and benchmark. Technical report. https://www.researchgate.net/publication/328600555_Reusable_coffee_cups_life_cycle_assessment_and_benchmark (Accessed on: 27 May 2025).
Andrews J. 2022. WMF – a brief history of coffee machines. https://www.linkedin.com/pulse/wmf-brief-history-coffee-machines-jonathan-ison/ (Accessed on: 6 July 2025).
Arellano C., and Hernández C. 2023. Carbon footprint and carbon storing capacity of Arabica coffee plantations of Central America: a review. Coffee Sci. 18:e182072. 10.25186/.v18i.2072
Arias A., Ioannidou M., Giannakis N., Feijoo G., Moreira M.T., and Koutinas A. 2023. Review of potential and prospective strategies for the valorization of coffee grounds within the framework of a sustainable and circular bioeconomy. Ind Crops Prod. 205:117504. 10.1016/j.indcrop.2023.117504
Arzoumanidis I., Salomone R., Petti L., Mondello G., and Raggi A. 2017. Is there a simplified LCA tool suitable for the agri-food industry? An assessment of selected tools. J Clean Prod. 149:406–425.
Aterini L. 2025. Rifiuti organici, oltre il 70% degli impianti italiani di gestione lavora in perdita economica. https://www.greenreport.it/news/green-economy/4711-rifiuti-organici-oltre-il-70-degli-impianti-italiani-di-gestione-lavora-in-perdita-economica (Accessed on: 8 June 2025).
British Standards Institution (BSI). 2011. Specification for the assessment of the life cycle greenhouse gas emissions of goods and services, PAS 2050:2011. BSI, London.
Brommer E., Stratmann B., and Quack D. 2011. Environmental impacts of different methods of coffee preparation. Int J Consumer Stud. 35:212–220.
Bush E., Josephy B., Heutling S., and Grießhammer R. 2009. Strategies to Enhance Energy Efficiency of Coffee Machines. Topten International Group TIG, Paris, France.
Büsser S., and Jungbluth N. 2009. The role of flexible packaging in the life cycle of coffee and butter. Int J Life Cycle Assess. 14(Suppl 1):S80–S91.
Chayer J.-A., and Kicak K. 2015. Life cycle assessment of coffee consumption: comparison of single-serve coffee and bulk coffee brewing. Final Report. Quantis©, Lausanne, CH. https://studylib.net/doc/8894288/life-cycle-assessment-of-coffee-consumption--comparison-of (Accessed on: 11 July 2025).
Chéron-Bessou C., Acosta-Alba I., Boissy J., Payen S., Rigal C., Setiawan A.A.Rf., Sevenster M., Tran T., and Azapagic A. 2024. Unravelling life cycle impacts of coffee: why do results differ so much among studies? Sustain Prod Consum. 47:251–266. 10.1016/j.spc.2024.04.005
Cibelli M., Cimini A., Cerchiara G., and Moresi M. 2021. Carbon footprint of different methods of coffee preparation. Sustain Prod Consum. 27:1614–1625. 10.1016/j.spc.2021.04.004
Coltro L., Mourad A.L., Oliveira P.A.P.L.V., Baddini J.P.O.A., and Kletecke R.M. 2006. Environmental profile of Brazilian green coffee. Int J Life Cycle Assess. 11(1):16–21. 10.1065/lca2006.01.230
Comitato Italiano del Caffè. 2018. Disciplinare caffè espresso 2018. https://www.espressoitalianotradizionale.it/wp-content/uploads/2018/05/Disciplinare-Caff%C3%A8-Espresso-Italiano-Tradizionale-2018-def.pdf (Accessed on: 5 July 2025).
Comitato Italiano del Caffè. 2020. Disciplinare del Caffè Moka 2020. https://www.comunicaffe.it/disciplinare-moka-parametri/ (Accessed on: 5 July 2025).
De Monte M., Padoano E., and Pozzetto D. 2005. Alternative coffee packaging: an analysis from a life cycle point of view. J Food Eng. 66(4):405–411. 10.1016/j.jfoodeng.2004.04.006
Domínguez-Patiño J., Martínez A., Romero R., and Orozco I. 2014. Life cycle assessment on real time in a coffee machine. J Chem Chem Eng. 8:1142–1149. 10.17265/1934-7375/2014.12.007
Dubois C., Humbert S., and Margni M. 2011. Comparative full life cycle assessment of B2C cup of espresso made using a packaging and distribution system from Nespresso Espresso and three generic products. Final report. Quantis Suisse, Lausanne, Switzerland. https://studylib.net/doc/8894294/comparative-full-life-cycle-assessment-of-b2c-cup-of (Accessed on: 5 July 2025).
EcoInvent. 2024. Allocation cut-off by classification. https://support.ecoinvent.org/system-models#Allocation_classification (Accessed on: 5 July 2025).
Eneroth H., Karlsson Potter H., and Röös E. 2022. Environmental effects of coffee, tea and cocoa–data collection for a consumer guide for plant-based foods. Report No. 122. Department of Energy and Technology, Swedish University of Agricultural Sciences, Uppsala, Sweden. 10.54612/a.2n3m2d2pjl.
Environmental Product Declarations® (EPD). 2019a. Moka coffee product category classification: UN CPC 23912. Version 1.01. https://api.environdec.com/api/v1/EPDLibrary/Files/1458db8f-cff6-417f-8aca-a84f8be224bc/Data (Accessed on: 5 July 2025).
Environmental Product Declarations® (EPD) 2019b. Espresso coffee product category classification: UN CPC 23912. Version 1.01. https://api.environdec.com/api/v1/EPDLibrary/Files/ab824bcd-b45a-43f1-8843-d97535ac67b8/Data (Accessed on: 5 July 2025).
European Coffee Federation. 2024. European coffee report 2023–2024. https://www.ecf-coffee.org/wp-content/uploads/2024/07/European-Coffee-Report-2023-2024.pdf (Accessed on: 21 May 2025).
European Commission. 2018. Product Environmental Footprint Category 2 Rules Guidance 3. Version 6.3. https://eplca.jrc.ec.europa.eu/permalink/PEFCR_guidance_v6.3-2.pdf (Accessed on: 5 July 2025).
European Commission. 2021. Commission Recommendation (EU) 2021/2279 of 15 December 2021 on the use of environmental footprint methods to measure and communicate the life cycle environmental performance of products and organisations. Off J Eur Union. L471/1:1–396. https://eur-lex.europa.eu/legal-content/EN/TXT/PDF/?uri=CELEX:32021H2279 (Accessed on: 5 July 2025).
European Committee for Electrotechnical Standardization (CENELEC). 2014. Methods for Measuring the Performance of Electric Household Coffee Makers, EN 60661:2014-05. CENELEC, Brussels, Belgium.
European Union (EU). 1994. European Parliament and Council Directive 94/62/EC of 20 December 1994 on packaging and packaging waste. Off J Eur Union L365:10–23. https://eur-lex.europa.eu/eli/dir/1994/62/oj/eng (Accessed on: 12 May 2025).
Evangelista R., Mariotta C., Ricciardi F., and Tuscano J. 2023. Imballaggi e rifiuti di imballaggio. In Chapter 4: Rapporto Rifiuti Urbani. Edizione 2023. Rapporti 393/2023. ISPRA, Rome, pp. 189–219. https://www.isprambiente.gov.it/it/pubblicazioni/rapporti/rapporto-rifiuti-urbani-edizione-2023 (Accessed on: 7 June 2025).
Fisk I.D., Kettle A., Hofmeister S., Virdie A., and Silanes Kenny J. 2012. Discrimination of roast and ground coffee aroma. Flavour. 1:14. 10.1186/2044-7248-1-14
Forcina A., Petrillo A., Travaglioni M., di Chiara S., and De Felice F. 2023. A comparative life cycle assessment of different spent coffee ground reuse strategies and a sensitivity analysis for verifying the environmental convenience based on the location of sites. J Clean Prod. 385:135727. 10.1016/j.jclepro.2022.135727
Freitas V.A., Rodrigues Borges L.L., Teixeira Ribeiro Vidigal M.C., Henrique dos Santos M., and Stringheta P.C. 2024. Coffee: A comprehensive overview of origin, market, and the quality process. Trends Food Sci Technol. 146:104411. 10.1016/j.tifs.2024.104411
Grant T. 2020. A brief history of coffee pods. https://perfectdailygrind.com/2020/08/a-brief-history-of-coffee-pods-nespresso-keurig-capsules/ (Accessed on: 5 July 2025).
Guglani A. 2021. NEXE’s patented compostable capsule for Keurig® brewing systems is finally here. https://www.prnewswire.com/news-releases/nexes-patented-compostable-capsule-for-keurig-brewing-systems-is-finally-here-301412728.html (Accessed on: 5 July 2025).
Hassard H.A., Couch M.H., Techa-erawan T., and McLellan B.C. 2014. Product carbon footprint and energy analysis of alternative coffee products in Japan. J Clean Prod. 73:310–321.
Hejna A. 2021. Potential applications of by-products from the coffee industry in polymer technology–current state and perspectives. Waste Manag. 121:296–330. 10.1016/j.wasman.2020.12.018
Heller M. 2017. Food Product Environmental Footprint Literature Summary: coffee. Center for Sustainable Systems, University of Michigan, MI (with support from the Oregon Sustainability Board). https://docslib.org/doc/2428585/food-product-environmental-footprint-literature-summary-coffee#google_vignette (Accessed on: 29 May 2025).
Henris K. 2025. The ideal coffee temperature to serve coffee. https://coffeenatics.com/brewing-tips/the-ideal-coffee-temperature-to-serve-coffee/ (Accessed on: 5 July 2025).
Hicks A.L. 2017. Environmental implications of consumer convenience: coffee as a case study. J Ind Ecol. 22(1):79–91. 10.1111/jiec.12487
House of Switzerland. 2017. Éric Favre – the Swiss inventor who put coffee into capsules. https://houseofswitzerland.org/swissstories/economics/eric-favre-swiss-inventor-who-put-coffee-capsules (Accessed on: 5 July 2025).
Humbert S., Loerincik Y., Rossi V., Margni M., and Jolliet O. 2009. Life cycle assessment of spray dried soluble coffee and comparison with alternatives (drip filter and capsule espresso). J Clean Prod. 17:1351–1358.
Iascone B. 2020. Caffè&tè: ilmercato in Italia. https://italiaimballaggio.it/fatti-e-dati/caffe-te-il-mercato-italia (Accessed on: 5 July 2025).
International Coffee Organization (ICO). 2022. 2021 Coffee Development Report: The Future of Coffee. ICO, London, pp. 68–78. https://www.icocoffee.org/wp-content/uploads/2022/11/coffee-development-report-2021.pdf (Accessed on: 5 July 2025).
International Organization for Standardization (ISO). 2006a. 14040-Environmental Management e Life Cycle Assessment – Principles and Framework. ISO, Genève, CH.
International Organization for Standardization (ISO). 2006b. 14044-Environmental Management – Life Cycle Assessment – Requirements and Guidelines. ISO, Genève, CH.
Italia Insights. 2024. Il Mercato delle capsule di caffè in Italia. https://italiainsights.it/ricerche-di-mercato/agroalimentare-alimenti/il-mercato-delle-capsule-di-caffe-in-italia/ (Accessed on: 26 May 2025).
Italian Institute for Environmental Protection and Research (ISPRA). 2024. Tasso di riciclaggio dei rifiuti urbani organici. https://indicatoriambientali.isprambiente.it/it/rifiuti/tasso-di-riciclaggio-dei-rifiuti-urbani-organici (Accessed on: 8 June 2025).
Janissen B., and Huynh T. 2018. Chemical composition and value-adding applications of coffee industry by-products: a review. Resour Conserv Recycl. 128:110–117. 10.1016/j.resconrec.2017.10.001
Jeszka-Skowron M., Sentkowska A., Pyrzyńska K., and De Peña M.P. 2016. Chlorogenic acids, caffeine content and antioxidant properties of green coffee extracts: influence of green coffee bean preparation. Eur Food Res Technol. 242:1403–1409. 10.1007/s00217-016-2643-y
Kadirvel V., Palanisamy Y., and Ganesan N.D. 2025. Active packaging system–an overview of recent advances for enhanced food quality and safety. Packag Technol Sci. 38(2):145–162. 10.1002/pts.2863
Killian B., Rivera L., Soto M., and Navichoc D. 2013. Carbon footprint across the coffee supply chain: the case of Costa Rican coffee. J Agr Sci Technol. 3:151–170.
Kraeutler T., Krowiak A., Mercurio D., and Oriol L. 2015. Coffee energy audit: an analysis of coffee energy consumption and efficiency at Boston College. Environmental Seminar ENVS4943. https://www.bc.edu/content/dam/files/schools/cas_sites/envstudies/pdf/Student%20Research/2015%20project%20paper/paper-1.pdf (Accessed on: 22 January 2021).
Ludmir C. 2023. Nespresso launches its first paper-based compostable capsules. https://www.forbes.com/sites/claraludmir/2023/09/13/nespresso-launches-its-pilot-of-home-compostable-capsules/ (Accessed on: 22 May 2025).
Maletic M. 2023. Coffee production and export statistics: latest data on global coffee trade. https://craftcoffeespot.com/coffee-production-and-export-statistics/ (Accessed on: 26 May 2025).
Marinello S., Balugani E., and Gamberini R. 2021. Coffee capsule impacts and recovery techniques: a literature review. Packag Technol Sci. 34:665–682.
McCarrick A., Letter B., O’Dwyer S., Knighton M., and Neal S.J. 2019. Carbon monoxide release from whole bean roasted coffee in storage. In: Proceedings of the 49th International Conference on Environmental Systems ICES-2019-172, Boston, MA, 7–11 July; pp. 1–15. https://ttu-ir.tdl.org/bitstream/handle/2346/84940/ICES-2019-172.pdf (Accessed on: 7 June 2025).
Medical News Today. 2023. Caffeine content of different types of coffee. https://www.medicalnewstoday.com/articles/324986 (Accessed on: 7 June 2025).
Mindful Sip 2024. The environmental impact of styrofoam cups. https://www.mindfulsip.org/the-environmental-impact-of-styrofoam-cups/ (Accessed on: 5 July 2025).
Murthy P.S., and Naidu M.M. 2012. Recovery of phenolic antioxidants and functional compounds from coffee industry by-products. Food Bioprocess Technol. 5(3):897–903. 10.1007/s11947-010-0363-z.
Nab C., and Maslin M. 2020. Life cycle assessment synthesis of the carbon footprint of Arabica coffee: case study of Brazil and Vietnam conventional and sustainable coffee production and export to the United Kingdom. Geogr Environ. 7(2):e00096. 10.1002/geo2.96
Nestlè. 2022. Nespresso, pioneer of premium single-serve coffee, unveils new range of home compostable coffee capsules. https://www.nestle.com/media/news/nespresso-unveils-compostable-coffee-capsules (Accessed on: 22 May 2025).
Noponen M.R.A., Edwards-Jones G., Haggar J.P., Soto G., Attarzadeh N., and Healey J.R. 2012. Greenhouse gas emissions in coffee grown with differing input levels under conventional and organic management. Agr Ecosyst Environ. 151:6–15.
OnWin. n.d.a. CM03 seria aluminum empty Nespresso compatible capsules. https://www.capsulemate.com/post/cm03-seria-aluminum-empty-nepsresso-compatible-capsules (Accessed on: 10 June 2025).
OnWin. n.d.b. CM21PB-C compostable/bio-base empty Nespresso compatible capsules. https://www.capsulemate.com/post/cm21pb-c-compostable-bio-base-empty-nepsresso-compatible-capsules (Accessed on: 10 June 2025).
Pavan A. 2024. La gestione del rifiuto indifferenziato in Italia. https://www.consorziosea.it/la-gestione-del-rifiuto-indifferenziato-italia/ (Accessed on: 7 June 2025).
PCF Pilotprojekt Deutschland. 2008. Case study Tchibo private kaffee: rarity machare by Tchibo. http://www.pcf-projekt.de/files/1232962944/pcf_tchibo_coffee.pdf (Accessed on: 5 July 2025).
Pergolizzi A. 2024. Il Tesoro nascosto dei rifiuti organici. https://www.rigeneriamoterritorio.it/il-tesoro-nascosto-dei-rifiuti-organici/ (Accessed on: 8 June 2025).
Phrommarat B. 2019. Life cycle assessment of ground coffee and comparison of different brewing methods: a case study of organic Arabica coffee in northern Thailand. Environ Nat Res J. 17(2):96–108.
Quantis. 2015. Life cycle assessment of coffee consumption: comparison of single-serve coffee and bulk coffee brewing. Final report. https://kidv.nl/LCA%20of%20coffee%20consumption:%20comparison%20of%20single-serve%20coffee%20and%20bulk%20coffee%20brewing (Accessed on: 6 June 2025).
Quantis. 2024. Life cycle assessment (LCA) of a lungo cup of coffee made from a Nespresso original capsule compared with other coffee systems in Europe. https://nestle-nespresso.com/sites/site.prod.nestle-nespresso.com/files/Nespresso_European_LCA_Executive_Summary_Quantis_2024.pdf (Accessed on: 6 June 2025).
Rahmah D.M., Putra A.S., Ishizaki R., Noguchi R., and Ahamed T. 2022. A life cycle assessment of organic and chemical fertilizers for coffee production to evaluate sustainability toward the energy–environment–economic nexus in Indonesia. Sustainability. 14:3912. 10.3390/su14073912
Redazione Beverfood.com. 2024. Report Beverfood.com sul mercato del caffè in Italia 2023: import, export e consumi. https://www.beverfood.com/report-beverfoodcom-mercato-caffe-italia-2023-import-export-e-consumi-wd/ (Accessed on: 11 July 2025).
Ridder M. 2024. Major coffee importing countries worldwide 2023. https://www.statista.com/statistics/1096400/main-import-countries-for-coffee-worldwide/ (Accessed on: 11 July 2025).
Ridder M. 2025. Major coffee exporting countries worldwide 2024. https://www.statista.com/statistics/1096413/main-export-countries-for-coffee-worldwide/ (Accessed on: 11 July 2025).
Sala S., Cerutti A.K., and Pant R. 2018. Development of a Weighting Approach for the Environmental Footprint. Publications Office, European Union, Luxembourg. https://op.europa.eu/en/publication-detail/-/publication/6c24e876-4833-11e8-be1d-01aa75ed71a1/language-en (Accessed on: 16 May 2025).
Sala S., Crenna E., Secchi M., and Pant R. 2017. Global normalisation factors for the environmental footprint and life cycle assessment. JRC scientific report. Publications Office, European Union, Luxembourg. https://op.europa.eu/en/publication-detail/-/publication/3ec9e2cb-f1cc-11e7-9749-01aa75ed71a1/language-en (Accessed on: 16 May 2025).
Sarmento dos Muchangos L., Mejia C., Gupta R., Sadreghazi S., and Kajikawa Y. 2025. A systematic review of life cycle assessment and environmental footprint for the global coffee value chain. Environ Impact Assess Rev. 111:107740. 10.1016/j.eiar.2024.107740
Schwizgebel C., Napierska D., Copello L., Veillard L., Musso M., Falkenberg M., and Lujan T. 2025. Packaging and packaging waste regulation implementation. https://rethinkplasticalliance.eu/wp-content/uploads/2025/03/PPWR-implementation-guide-for-national-and-local-governments.pdf (Accessed on: 12 May 2025).
Shabbir S. 2024. Coffee brewing methods: 16 different ways to make it. https://coffeebrewster.com/coffee-brewing-methods/ (Accessed on: 27 May 2025).
Shahbandeh M. 2024. Global UTZ certified coffee production volume 2011–2023. https://www.statista.com/statistics/758463/utz-certified-coffee-production-volume-worldwide/ (Accessed on: 26 May 2025).
Shahbandeh M. 2025. Coffee production worldwide in 2023/24, by region (in million 60-kilogram bags). https://www.statista.com/statistics/545433/global-coffee-production-region/ (Accessed on: 21 May 2025).
Sustainable Plastics. 2020. Ingeo-based GEA coffee capsules comply with industrial composting standard. https://www.sustainableplastics.com/news/ingeo-based-gea-coffee-capsules-comply-industrial-composting-standard (Accessed on:18 May 2023).
Vasuki M.T., Kadirvel V., and Pejavara Narayan G. 2023. Smart packaging—an overview of concepts and applications in various food industries. Food Bioeng. 2(1):25–41. 10.1002/fbe2.12038
Wang A. 2021. Application of laser particle size analyzer in coffee. https://www.3p-instruments.com/wp-content/uploads/2021/06/Application-of-Laser-Particle-Size-Analyzer-In-Coffee.pdf (Accessed on: 5 July 2025).
World Bank. 2020. Why biodiversity matters to your daily cup of coffee: preserving the birthplace of wild Arabica coffee in Ethiopia’s highlands. https://www.worldbank.org/en/news/feature/2020/06/04/why-biodiversity-matters-to-your-daily-cup-of-coffee (Accessed on: 5 July 2025).
World Population Review. 2025. Coffee consumption by country 2025. https://worldpopulationreview.com/country-rankings/coffee-consumption-by-country (Accessed on: 11 May 2025).
Yaqub M. 2025. Coffee consumption statistics: a must know in 2025. https://www.coffeedasher.com/coffee-consumption-statistics/ (Accessed on: 11 May 2025).
YouGov®. 2021. Italian coffee report 2021: analysis of coffee consumption in Italy. Coffee Promotion Consortium. https://www.caffebenessere.it/wp-content/uploads/2022/02/YouGov_Coffee_Study_ITA.pdf (Accessed on: 11 May 2025).