
Download
Y i e l d % = grams CP grams CPF × 100 DE % = V 2 m L V 1 m L + V 2 m L + V 3 m L − V 4 m L × 100 DAm % = V 3 m L V 1 m L + V 2 m L + V 3 m L − V 4 m L × 100 DA % = V 4 × 10 − 3 L × 0.05 m o l / L 0.500 g × 0.821 × 194.14 g / m o l × 100 M e O % = 16.32 100 × D E 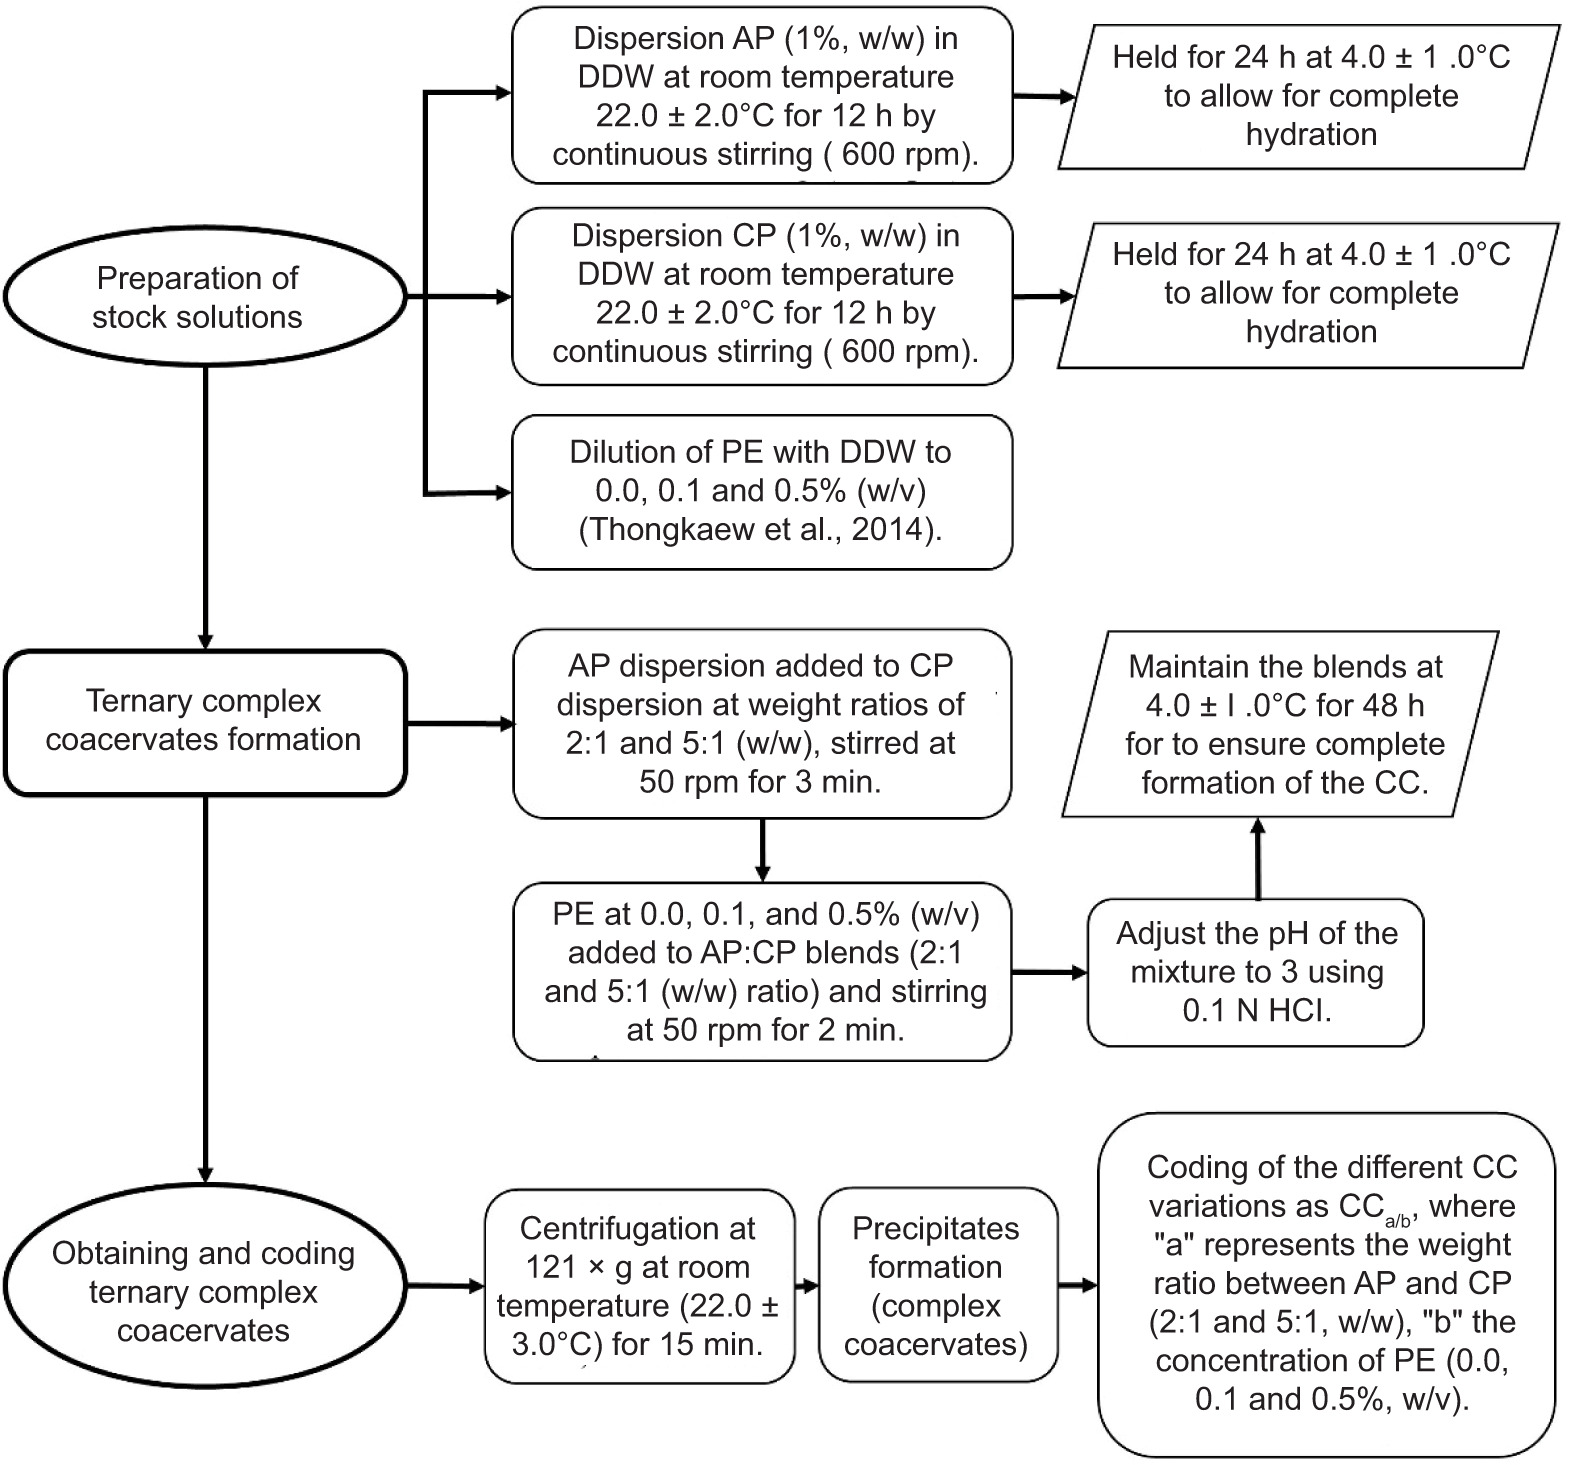
Y i e l d % = C C B T × 100 I n h i b i t i o n % = Abs Control − Abs Sample Abs Control × 100
ORIGINAL ARTICLE
Amaranth protein–cacao pectin/phenolic extract complex
Karla García-de la Rosa1, Landy Hernández-Rodríguez2*, Consuelo Lobato-Calleros2, E. Jaime Vernon-Carter3, Juan Carlos Cuevas-Bernardino4
1Posgrado en Ciencia y Tecnología Agroalimentaria, Departamento de Ingeniería Agroindustrial, Universidad Autónoma Chapingo, Texcoco, México;
2Departamento de Preparatoria Agrícola, Universidad Autónoma Chapingo, Texcoco, México;
3Departamento de Ingeniería de Procesos e Hidráulica, Universidad Autónoma Metropolitana-Iztapalapa, Ciudad de México, México;
4CONACYT-Centro de Investigación y Asistencia en Tecnología y Diseño del Estado de Jalisco (CIATEJ) Unidad Sureste, Mérida, México
Abstract
Agricultural waste can be successfully channeled into organic components with improved functional properties. The interactions between Amaranth protein (AP), cacao pod husk pectin (CP), in 2:1 and 5:1 weight ratios, and cacao shell/husk phenolic extract (PE) (0.0, 0.1, 0.5% w/v), were conducted at pH 3 to produce ternary complex coacervates (CC). CC displayed ζ-potential values approaching charge neutrality; FTIR spectra showed transposed peaks; SEM micrographs revealed heterogeneous and porous structures, which were distinct from those exhibited by the individual components. CC yield and antioxidant activity were higher as the AP:CP weight ratio and PE concentration increased. CC may be considered promising ingredients for developing novel food products with enhanced properties.
Key words: amaranth protein, complex coacervation, microstructure, pectin, phenolic extract
*Corresponding Author: L. Hernández-Rodríguez, Departamento de Preparatoria Agrícola, Universidad Autónoma Chapingo, km. 38.5 Carretera México-Texcoco, Texcoco CP 56230, México. Email: [email protected]
Academic Editor: Prof. Carla Di Mattia—University of Teramo, Italy
Received: 22 April 2025; Accepted: 14 June 2025; Published: 1 October 2025
© 2025 Codon Publications
This is an Open Access article distributed under the terms of the Creative Commons Attribution-NonCommercial-ShareAlike 4.0 International (CC BY-NC-SA 4.0). License (http://creativecommons.org/licenses/by-nc-sa/4.0/)
Introduction
Currently, the fabrication of ternary protein–polysaccharide–polyphenol complexes has gained interest as potential prospects for application in industries such as: Food and Beverage, due to the improved stability of bioactive compounds; Pharmaceutical and Cosmetic, where they are used as drug delivery systems to encapsulate active ingredients, enhancing their stability and efficacy; and Biotechnology and Biomedicine, through the development of nanocarriers for specific biomolecules (Yan et al., 2023). In this sense, the complexes present several benefits, such as: enhanced stability against environmental stresses (temperature, pH, and ionic strength); increased shelf-life by protecting sensitive ingredients from adverse environmental factors; targeted delivery through the design of carrier systems that release their payload in response to specific stimuli (pH, temperature, or enzymes); increased bioavailability and bioactivity of active ingredients by facilitating their interaction with biological targets; and effectiveness as antioxidant and antimicrobial agents to prevent food contamination, among others (Huang et al., 2016; Wang et al., 2020; Xu et al., 2023; Yan et al., 2023). To take advantage of and optimize these benefits, it is essential to investigate and understand the physicochemical properties of ternary complexes, since interactions between the polymer molecules that compose them can produce complexes with different characteristics (Yao et al., 2019). The interactions between protein, polysaccharide, and polyphenol can be controlled through the formation of complex coacervates, which are structures formed by the association between oppositely charged biopolymers via electrostatic interactions, resulting in the separation of colloidal dispersion into two phases: an equilibrium serum phase and a precipitate phase. Other factors such as variations in pH, functional groups, protein–polysaccharide weight ratio, total concentration, surface charge density, and the chemical nature and origin of biopolymers affect the formation of coacervates (Koralegedara et al., 2020).
The biopolymers most commonly used for the formation of coacervates are of animal origin, such as gelatin, whey proteins, and ovalbumin. However, plant-based proteins have been increasingly utilized, including those from peas, chia, flaxseed, soybean, and canola. The most frequently used polysaccharides are carrageenan, carboxymethylcellulose, gum Arabic, and commercial high methoxyl pectin (Muhoza et al., 2020). Notably, pectin has been combined with proteins to form highly interconnected networks that improve the functionality of both biopolymers (Lan et al., 2020). Polyphenols (i.e., (−)-epigallocatechin gallate, proanthocyanidins, hydroquinone) used in the formation of ternary complexes have been studied in various food systems for their nutritional properties (Yan et al., 2023). Therefore, it is necessary to investigate the role that proteins and polysaccharides play in the formation of ternary complex coacervates, as well as the potential health benefits they provide when incorporated into food matrices. In this sense, it has been reported that Amaranth proteins possess high biological value due to their well-balanced composition of essential amino acids and can be produced more sustainably than proteins of animal origin (Hadidi et al., 2024). Thus, an ongoing research topic is how to induce and enhance the complexation of Amaranth protein with other biomolecules and biopolymers (Hadidi et al., 2024; Figueroa-González et al., 2025) to achieve specific functionalities (i.e., surface-active properties) that may help develop novel foods with improved properties. Specifically, pectin has been extracted using a green process from cacao pod husks (Campos-Vega et al., 2018), which constitute a residue of the cacao industry (~22,000 tons annually) and a source of environmental pollution in Mexico (SIAP, 2023). In addition, extracted pectin has been reported to exhibit good surface and emulsifying properties (Trujillo-Ramírez et al., 2018). Furthermore, polyphenols can also be obtained from cacao wastes, such as seed shells and pod husks (Manzano et al., 2017), and they possess antioxidant, antimicrobial, and anti-inflammatory biological activities (Zhang et al., 2024). However, these compounds are easily degraded by exposure to light, oxygen, temperature, and pH (Pan-Utai and Iamtham, 2020), so their protection is essential.
Based on the above, this work aimed to establish the interaction conditions between Amaranth protein, cacao pod husk pectin, and cacao shell/husk polyphenols that lead to the formation of ternary complex coacervates, and to evaluate relevant physicochemical properties (i.e., yield, particle size, internal structure, color, antioxidant activity), with the goal of providing insights that may support their application in the design of new foods with desirable attributes.
Materials and Methods
Procurement of vegetal materials
Seeds of Amaranthus hypochondriacus L. variety Revancha were obtained from a local producer in the San Jose Atlan community, Huichapan municipality, State of Hidalgo, Mexico, with GPS coordinates of 20° 20° 26.4192" N, 99° 41° 39.7356" W, and an elevation above sea level of 2150 m. By-products (shell and husk) of Theobroma cacao L. were obtained from a local producer in the Arena 2nd Section community, Comalcalco municipality, State of Tabasco, Mexico, with GPS coordinates of 18° 10° 35.2" N, 93° 23° 50.4" W, and an elevation above sea level of 40 m.
Chemical reagents
Hydrochloric acid (HCl), sodium hydroxide (NaOH), citric acid, magnesium sulfate heptahydrate (MgSO4•7H2O), sulfuric acid (H2SO4), and analytical grade ethanol were procured from J.T. Baker (Xalostoc, State of Mexico, Mexico). Hexane was supplied by MEYER® Chemical Reagents (Tláhuac, Mexico City, Mexico). Sodium carbonate (Na2CO3), sodium tetraborate, 3-phenylphenol, D-galacturonic acid, gallic acid, 2,2°-azino-bis(3-ethylbenzothiazoline)-6-sulfonic acid (ABTS), 2,2-diphenyl-1-picrylhydrazyl (DPPH), 6-hydroxy-5,7,8-tetramethylchroman-2-carboxylic acid (Trolox), and sodium dodecyl sulfate (SDS) were purchased from Sigma-Aldrich Mexico (Toluca, State of Mexico, Mexico). All water used was distilled and deionized (DDW).
Amaranth protein isolate extraction
Amaranth protein (AP) was obtained according to the methodology described by García-de la Rosa et al. (2023). Briefly, seeds were cleaned, winnowed, and sorted to remove extraneous matter, followed by washing with water and drying (60°C, 24 h) in a RAD/RFD Lab Convection Oven (Despatch, Lakeville, MN, USA). The dried seeds were ground using an MCR model CAB-1000 Hammer Mill (Harlow, UK) and sieved through a 24-US mesh (0.8 mm) to obtain amaranth flour. Sixty g of flour were degreased using Soxhlet equipment with hexane (150 mL, 75°C, 5 h). The defatted amaranth flour (100 g) was dispersed in DDW (10% w/v) and stirred at 600 rpm (RO 15 power, IKA® Werke, Staufen, Germany) at room temperature (22.0 ± 2.0°C) for 60 min. Subsequently, the pH of the dispersion was adjusted to pH 11 using 1 N NaOH (Potentiometer, mod. pH 120, Conductronic; Santa Cruz Buenavista, State of Puebla, Mexico) and kept under continuous stirring for 60 min. The dispersion was then centrifuged at 9000×g at 10°C for 15 min using a 5810 R Eppendorf AG centrifuge (Hamburg, Germany). The pH of the resulting supernatant was adjusted to 4 using 1 N HCl, and the precipitated protein was recovered by centrifugation at 9000×g at 4°C for 15 min. The residue was washed three times with DDW and neutralized to pH 7 with 0.1 N NaOH. It was then dried in an HCF-62 oven (Riossa Digital, Mexico City, Mexico) at 40°C for 48 h with continuous fixed air circulation. The resulting isolate had a protein content of 85.3 ± 1.0% (Kjeldahl method, conversion factor 6.25). The dry isolate was manually ground and stored in sealable polyethylene bags at 4.0 ± 1.0°C until required for use.
Pectin extraction from the cacao pod husk
Cacao pod husk was cut into small pieces (~1 cm) and dehydrated in an air circulation oven at 55°C for 36 h. The dried pieces were ground using an Oster® BLSTBESTR blender (Mexico City, Mexico). A 0.8 mm sieve was used to obtain cacao pod husk flour (CPF) (Trujillo-Ramírez et al., 2018). The moisture content was determined by the oven-drying method. Briefly, 2 g of sample were placed in an HCF-62 oven (Riossa Digital, Mexico City, Mexico) at 102°C until constant weight was reached. Subsequently, the moisture percentage was calculated from the weight difference (AOAC, 1996). Protein was determined by the Kjeldahl method (considering a conversion factor of 6.25), lipids by the Soxhlet method, and ash and fiber according to AOAC (1996). Cacao pod husk pectin (CP) was extracted from CPF by acid hydrolysis using the methodology of Vriesmann et al. (2012). Moisture, protein, lipids, ash, fiber, and carbohydrate (by difference) content of CP were determined. The CP extraction yield was estimated using the following equation:
Physicochemical characterization of pectin from cacao pod husk
The characterization of CP was determined as reported by Trujillo-Ramírez et al. (2018), with slight modifications. Briefly, esterification degree (DE), amidation degree (DAm), and acetylation degree (DA) were determined by multi-step titration, reporting the volume consumed. First, a CP solution (0.5 g/100 mL of DDW) was prepared and titrated with 0.1 mol/L NaOH, using phenolphthalein as an indicator (V1). Subsequently, 20 mL of 0.5 mol/L NaOH was added to the CP to initiate saponification, 20 mL of 0.5 mol/L HCl was added to stop the reaction, and the excess HCl was neutralized by titration with 0.1 mol/L NaOH (V2). The solution was saturated with 20 mL of 2.5 mol/L NaOH for subsequent distillation; the condenser supply line was immersed in a mixture of 20 mL of 0.1 mol/L HCl and 150 mL of DDW. One hundred mL of distillate was obtained, and the excess HCl was titrated with 0.1 mol/L NaOH; methyl red was used as an indicator (S). A blank test was performed with 20 mL of 1 mol/L HCl (B). The volume difference between B and S was V3. Finally, 1 g of CP was dispersed in 50 mL of 0.125 mol/L NaOH, kept under constant stirring for 1 h, and the solution was diluted with DDW in a 100 mL volumetric flask. The diluted solution was mixed with 100 mL of Clark’s solution (100 g of MgSO4•7H2O, 0.8 mL of H2SO4, and 180 mL of H2O) and distilled to obtain 150 mL. The distillate was titrated with 0.05 mol/L NaOH to a pH of 8.5 (A). DDW was used as a blank for the titration (A0); the volume difference between A and A0 was V4. The following equations were used:
Methoxyl percentage (MeO %) was calculated from the following equation, considering that the amount of methoxyl groups in 100% esterified pectin is 16.32%.
Galacturonic acid quantification was estimated by the sulfamate/3-phenylphenol colorimetric assay (D-galacturonic acid standard curve with a concentration range of 8-80 ug/mL).
Phenolic extract (PE) obtention
Sample preparation was carried out according to the methodology of Gaber-Ahmed et al. (2020), with slight modifications. Dried cacao pod husks and cacao shells were ground, and a 0.8 mm sieve was used to obtain CPF and cacao bean shells flour (CSF); moisture, protein, lipids, ash, fiber, and carbohydrate content were determined. After that, crude extracts of CPF (2.5 g) and CSF (2.5 g) were prepared in 100 mL of 75% (v/v) ethanol and kept under continuous stirring for 90 min in darkness. The solution was centrifuged at 5000×g for 5 min; the supernatant was filtered through nylon filters (0.45 μm). The crude extract was stored in darkness at 4.0 ± 1.0°C until required for use.
Ternary complex coacervates formation
The experimental protocol to carry out the formation of the ternary complex coacervate (Figure 1) was established using the methodology proposed by Hernández-Rodríguez et al. (2014).
Figure 1. Experimental protocol for the formation of ternary complex coacervates (CCa/b). AP = amaranth protein isolate; CP = cacao pod husk pectin; PE = phenolic extract; DDW = deionized water.
Determination of pH for complex coacervates formation
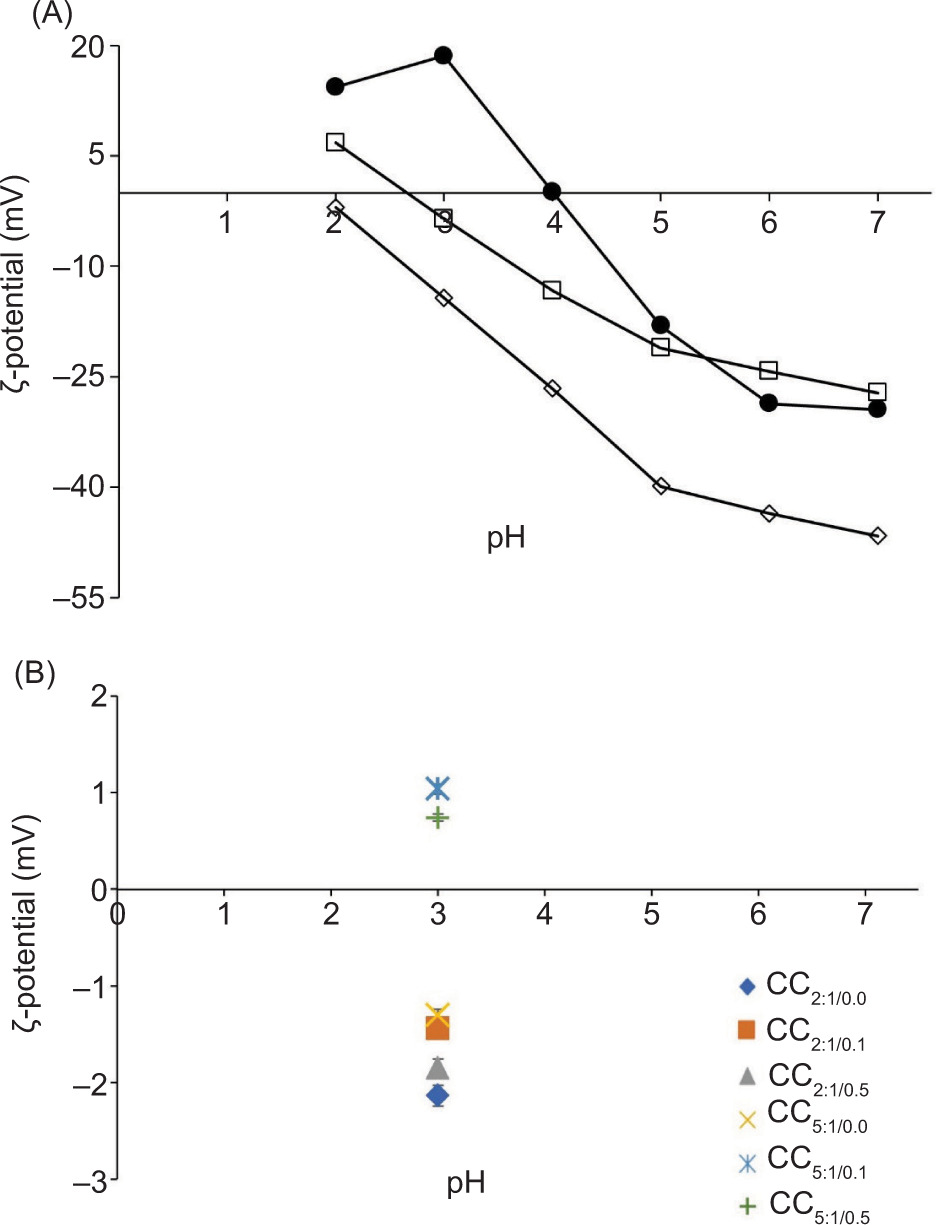
ζ-potential of AP, CP, and PE dispersions was measured at a dilution of 0.01% (w/v) in a pH range of 2 to 7 with a Zetasizer Nano ZS (Malvern Instruments, Ltd., Worcestershire, UK). The pH of the dispersions was adjusted using 0.1 N HCl or 0.1 N NaOH (García-de la Rosa et al., 2023). Based on these data, an interaction window between the protein, polysaccharide, and polyphenol was established according to their relative electrical charge. A pH of 3 was selected for the formation of the complex coacervates (See Figure 2).
Figure 2. (A) ζ-potential variation as a function of pH for amaranth protein (AP) (●), cacao pod husk pectin (CP) (◊), and phenolic extract of cacao shell/husk (PE) (□) solutions (0.01% w/w). (B) ζ-potential of ternary complex coacervates (CCa/b) at different AP:CP weight ratios and PE concentrations (0.0, 0.1, 0.5%) as a function of pH.
Turbidimetric measurements for the complex coacervates formation
Optimal ratios for forming insoluble complexes between AP and CP were determined by turbidimetric measurements using the methodology of Ramírez-Santiago et al. (2012), with slight modifications. AP (1%, w/v) and CP (1%, w/v) dispersions’ pH was adjusted between 2 and 7 with 0.1 N HCl or 0.1 N NaOH. The dispersions were mixed at AP:CP weight ratios of 1:1 to 8:1 (w/w) with a total biopolymer concentration of 1% (w/v). The mixtures were stirred at 600 rpm for 30 min and left to rest at 4.0 ± 1.0°C for 48 h to allow them to reach the equilibrium phase. The complex coacervates were separated from the soluble ones by centrifugation at 121×g for 15 min at 20°C. Subsequently, the absorbance of the supernatants was measured at a wavelength of 600 nm in a Genesys 10S UV-Vis spectrophotometer (Thermo Scientific Fisher, Waltham, MA, USA).
Physicochemical characterization of complex coacervates
Complex coacervates yield
Coacervation yield was obtained using the following equation:
where: CC is complex coacervate weight on dry basis (g) and BT is total weight of biopolymers used on a dry basis (g).
ζ-potential and mean hydrodynamic diameter (Dh)
The ζ-potential and mean hydrodynamic diameter (Dh) of CCa/b was determined using a Zetasizer Nano ZS (Malvern Instruments, Ltd., Worcestershire, UK). CCa/b were diluted in DDW to 0.01% (w/w), and pH was adjusted to 3 with 0.1 N HCl or 0.1 N NaOH.
Fourier transform infrared spectroscopy (FTIR)
The FTIR spectra of AP, CP, PE, and CCa/b were determined with a CARY 630 spectrophotometer (Agilent Technologies, Inc., Santa Clara, CA, USA), equipped with a universal attenuated total reflectance fixture. Dry samples of AP, CP, PE, and CCa/b variations (~10 mg) were placed in contact with the diamond crystal with a geometry adjustment to a force calibration of 60 units. Absorbance was measured over the range of 4000 cm–1 to 650 cm–1 at a spectral resolution of 16 cm–1. A total of 128 scans were carried out per sample and integrated to obtain the mean values of the spectrum (García-de la Rosa et al., 2023).
Scanning electron microscopy (SEM)
SEM micrographs of the CCa/b variations were obtained with a JSM-6360 Jeol SEM microscope (Tokyo, Japan) at an acceleration voltage of 15 kV. CCa/b were fixed with a solution of 2% (w/v) glutaraldehyde in phosphate buffer (0.1 M, pH 7.2) for 6 h, followed by dehydration in aqueous ethanol solutions with increasing concentrations (20, 30, 50, 60, 70, 80, 90, and 100%, v/v) for 60 min each. Immediately after, CCa/b were critically dried in a CPA II Technics Critical Point Dryer (Tousimis, Rockville, MD, USA). A sample of each CCa/b was placed directly on the surface of an aluminum sample holder with carbon tape and coated with gold at 1.5 kV, 5–6 mA, in a JFC 1100 vacuum sputter coater (JEOL, Tokyo, Japan) (Hernández-Rodríguez et al., 2014). Micrographs are presented at magnifications of 5000× and 10000×.
Colorimetry
CIELAB color parameters L*, a*, and b* of CCa/b variation samples were measured with a CR-400 colorimeter (Konica Minolta, Tokyo, Japan). L* indicates luminosity; a* indicates red/green; and b* indicates yellow/blue. Hue angle (H* = tan–1 b*/a*) was calculated, indicating sample color, and Chroma (C* = [a 2 + b2]1/2) indicating purity or saturation of color (Kuck and Noreña, 2016).
Antioxidant activity
The antioxidant activity of AP, CP, PE and CCa/b was determined by three methods:
-
The Folin-Ciocalteu method was used to determine the total phenolic content (TPC), as described by Murcia and Castañeda (2022), with some modifications. Twenty μL of each sample was placed in amber vials, and 450 μL of 1 N Folin-Ciocalteu reagent was added, stirred in a Vortex for 30 s, and left to rest for 10 min. Later, 450 μL of Na2CO3 at 20% (v/v) was added, and it was vortexed for 30 s, allowing the mixture to react in darkness for 90 min. Finally, the absorbance was measured at 760 nm using a spectrophotometer. A gallic acid calibration curve was used to determine the concentration of phenols, which was expressed as mg gallic acid equivalents (GAE) per gram of dry mass. PE underwent an analysis to identify substances using Gas Chromatography coupled to a Mass Spectrometer (GC-MS) (Agilent Technologies 7890B-5977A-MSD, Santa Clara, CA, USA). The MassHunter GC/MS Version Acquisition B.07.02.1938 software was used. One hundred μL of the sample was dried under N2 current and then silylated using BSTFA (50 μL) and 150 μL of HPLC grade dichloromethane at room temperature (22.0 ± 2.0°C) under continuous agitation for 60 min. Separation was carried out by injecting 1 μL into an HP-5 MS column (30 m length, 0.25 mm diameter, 0.25 μm thickness). Helium was used as a carrier gas at a flow rate of 1.0 mL/min. The injector temperature was 280°C. Temperature program for separation: T_initial = 40°C, T_intermediate = 200°C, with a ramp of 8°C/min, and T_final = 310°C for 5 min, with a temperature ramp of 8°C/min. Spectrometry was performed in electron impact ionization mode at 70 eV, in a range of 35 to 600 mass-to-charge ratio (m/z). The database used for comparing the mass spectra obtained was the National Institute of Standards and Technology (NIST) Version 14.0.
-
The radical scavenging activity using 2,2’-azino-bis(3-ethylbenzothiazoline)-6-sulfonic acid (ABTS) of each sample was determined as described by Adegbaju et al. (2020), with some modifications. The ABTS radical cation (ABTS+) was generated and diluted with ethanol to obtain a working solution with an absorbance of 0.70 ± 0.02 at 734 nm. The CCa/b samples were centrifuged at 121×g for 10 min, and sterile saline solution (0.9%) was added to the precipitate to disperse the coacervates. An aliquot of 10 μL of each sample was mixed with 990 μL of the ABTS+ solution and incubated in darkness for 7 min. Absorbance was then measured at 734 nm. The percentage of ABTS+ inhibition was calculated using the following equation.
where Abscontrol is ABTS+ absorbance, Abssample is absorbance of the ABTS+ plus sample or Trolox standard.
The radical scavenging activity using 2,2-diphenyl-1-picrylhydrazyl (DPPH•) assay was determined according to Cortés-Viguri et al. (2021), with slight modifications. After breaking the CCa/b coacervates as done in the ABTS assay, 20 μL of CCa/b supernatant or each sample was mixed with 2 mL of DPPH• ethanol solution (0.06 mM). The mixture was vortexed and incubated in darkness at 25°C for 30 min. Absorbance was measured at 517 nm using a spectrophotometer. DPPH• inhibition percentage was calculated using a Trolox standard curve, following a similar equation as for ABTS+, where Abs_control is the absorbance of DPPH• alone, and Abs_sample is the absorbance of DPPH• with sample or standard.
Statistical analysis
A completely randomized design of three independent experiments was used, with all measurements being performed in triplicate. Data were subjected to variance analysis when appropriate, using Tukey’s test. Significance was set at p ≤ 0.05. Statgraphics 7 software (Statistical Graphics Corp., Manugistics Inc., Cambridge, MA, USA) was used for data analysis.
Results and Discussion
Proximal chemical composition of cacao pod husk flour (CPF), cacao seed shell flour (CSF), and cacao pod husk pectin (CP)
The proximal chemical composition data obtained for CPF, CSF, and CP (Table 1) were consistent with what was reported in the literature (Campos-Vega et al., 2018; Cantele et al., 2020). The yield of CP was 11.4 ± 0.9% similar to the 11.7% reported by Hutomo et al. (2016), but higher than the 6.1% obtained by Trujillo-Ramírez et al. (2018).
Table 1. Proximal chemical composition of cacao pod husk flour (CPF), cacao seed shell flour (CSF), pod husk pectin (CP), and physicochemical characterization of CP.
| Component | CPF | CSF | CP |
|---|---|---|---|
| (%) | |||
| Moisture | 6.7 ± 0.1 | 8.2 ± 0.2 | 7.4 ± 0.1 |
| Ash | 11.5 ± 0.1 | 7.9 ± 0.1 | 16.5 ± 0.5 |
| Protein | 10.6 ± 0.6 | 11.8 ± 0.4 | 1.7 ± 0.1 |
| Lipids | 0.7 ± 0.1 | 9.1 ± 0.1 | 0.6 ± 0.1 |
| Crude fiber | 27.6 ± 0.6 | 18.7 ± 0.1 | 0.1 ± 0.1 |
| Carbohydrates | 49.6 ± 0.7 | 51.3 ± 0.2 | 74.1 ± 0.3 |
| DE | – | – | 63.4 ± 0.3 |
| Dam | – | – | 0.6 ± 0.3 |
| DA | – | – | 10.6 ± 1.7 |
| MeO | – | – | 10.4 ± 0.1 |
| Galacturonic acid | – | – | 72.9 ± 1.6 |
Data represent mean value ± standard deviation on a dry basis. DE = esterification degree; DAm = amidation degree; DA = acetylation degree; MeO = Methoxyl.
The physicochemical characterization values of CP reported by other authors are highly variable. This variability is mainly attributed to cultivation conditions, cacao variety, extraction method, and solvent employed (Trujillo-Ramírez et al., 2018; Vriesmann et al., 2012). Nevertheless, these parameter values allow us to draw certain conclusions regarding our extracted CP. Pectins are classified as low-methoxyl when they exhibit less than 50% esterification, while high-methoxyl pectins have more than 50% esterification. The DE, MeO, and galacturonic acid values indicate that CP can be considered a high-methoxyl pectin, possessing gel-forming properties suitable for use in the food and pharmaceutical industries (Kim et al., 2016; Trujillo-Ramírez et al., 2018). Likewise, CP has a degree of amidation (DAm) greater than 10% and low protein content, conditions associated with adequate emulsifying and interfacial properties. The DAm refers to the percentage of carboxyl groups (-COOH) in the CP modified with amino groups (-NH2). A higher DAm can reduce the sensitivity of CP to Ca2+ ions, affecting gel formation. Therefore, the low DAm value found indicates little influence on CP’s sensitivity to Ca2+, thus promoting a higher gel-forming capacity (Yang et al., 2022).
ζ- potential measurements
In general terms, the ζ-potential changed as the protein-polysaccharide-polyphenol ratio shifted, affecting the overall charge of the coacervates. A balanced charge ratio of opposite signs between the protein and polysaccharide—the two biopolymers present in the system at higher relative mass ratios—is crucial for inducing strong electrostatic interactions (Banjare et al., 2019). The most favorable charge balance occurs at the pH where the net charge between protein and polysaccharide is minimized, i.e., when their combined ζ-potential approaches zero. When a third component, such as PE, is introduced, it is advantageous for the charge balance between the protein and polysaccharide to remain positive, so that the negatively charged PE can shift the overall ζ-potential closer to zero. Figure 2a shows the variation of ζ-potential as a function of pH for AP, CP, and PE solutions. CP exhibited negative ζ-potential values throughout the pH range studied, from –1.9 ± 0.4 mV at pH 2 to –46.7 ± 1.3 mV at pH 7, consistent with findings reported by Salminen and Weiss (2013). This behavior is typical of high-methoxyl pectins, as the carboxyl groups (-COOH) have low pKa values. As pH increases, these groups ionize to carboxylate (-COO–), leading to increasingly negative ζ-potential values (Trujillo-Ramírez et al., 2018). For AP, ζ-potential ranged from +14.3 ± 0.3 mV at pH 2.0 to –29.5 ± 0.4 mV at pH 7.0, similar to values reported for Amaranthus hypochondriacus by Ventureira et al. (2012). At acidic pH, amino acid side chains are protonated (NH3+), resulting in positive ζ-potential, whereas at basic pH, carboxyl groups (-COOH) ionize to negative charges (-COO–), leading to negative ζ-potential. The protein’s isoelectric point (pI) marks the transition between these charge states (Espinosa-Andrews et al., 2007). PE showed ζ-potential values ranging from +6.7 ± 1.0 mV at pH 2.0 to –27.3 ± 0.4 mV at pH 7.0. Similar to proteins, phenolic extracts can exhibit positive or negative ζ-potential depending on pH: protonated and positively charged at acidic pH, deprotonated and negatively charged at alkaline pH (Malvern Instruments Limited, 2015). Phenols interact with proteins mainly via electrostatic interactions between phenolic hydroxyl groups and protein amino groups (Shahidi and Senadheera, 2019). As observed in Figure 2a, at around pH 3, PE and CP carry negative charges which balance with the positive charges of AP. Therefore, pH 3 was selected as the optimal condition to drive the formation of complex coacervates.
Coacervates formation not only depends on pH, but also on ionic strength, and biopolymers nature, proportion and concentration (Espinosa-Andrews et al., 2007). Furthermore, the conformation (their shape in solution) of ionic biopolymers (polyelectrolytes), significantly impacts their interaction with other molecules and their ζ-potential. Thus, the ζ-potential of ternary complexes is a dynamic property influenced by the ratio of protein, polysaccharide, and polyphenol components, pH, and the specific interactions between these molecules. The CCa/b exhibiting negative ζ-potential from highest to lowest were: CC2:1//0.0 > CC2:1/0.5 > CC2:1/0.1 > CC5:1/0.0, whereas those exhibiting positive ζ-potential values from lower to higher were: CC5:1/0.5 < CC5:1/0.1 (Figure 2b). Zhao et al. (2019) stated that tunable ternary complex coacervates could be achieved by understanding how different factors affected their ζ-potential. Following this, it may be inferred that at pH 3, the relative concentration and nature of the individual biopolymers in solution, affects their conformation, and the exposure of ionizable groups on their backbone, and ultimately, their ability to interact electrostatically with other biopolymers carrying and opposite charge (Espinosa-Andrews et al., 2007). At an AP:CP weight ratio of 2:1, it would seem, that the relative number of moieties negatively charged by the CP backbone exceeds the number of moieties positively charged by the AP backbone, resulting in an overall negative ζ-potential value (CC2:1/0.0). When PE was added to the AP:CP solution, it probably inhibited to a greater degree the of ionization of the moieties in the CP backbone than on the AP backbone, resulting in a lowering of the negative ζ-potential, which was more marked at a 0.1 than at a 0.5% w/v PE concentration. As the AP:CP weight ratio increased to 5:1, and the number of AP molecules relative to the number of CP molecules increased, the ionizable moieties in CP were shielded by an increasing number ionizable moieties of AP, resulting in a lower negative ζ-potential for CC5:1/0.0 than for all the CC2:1 counterparts. When PE was added to CC5:1, the ζ-potential shifted to positive values (Figure 2b).
Turbidimetric measurements
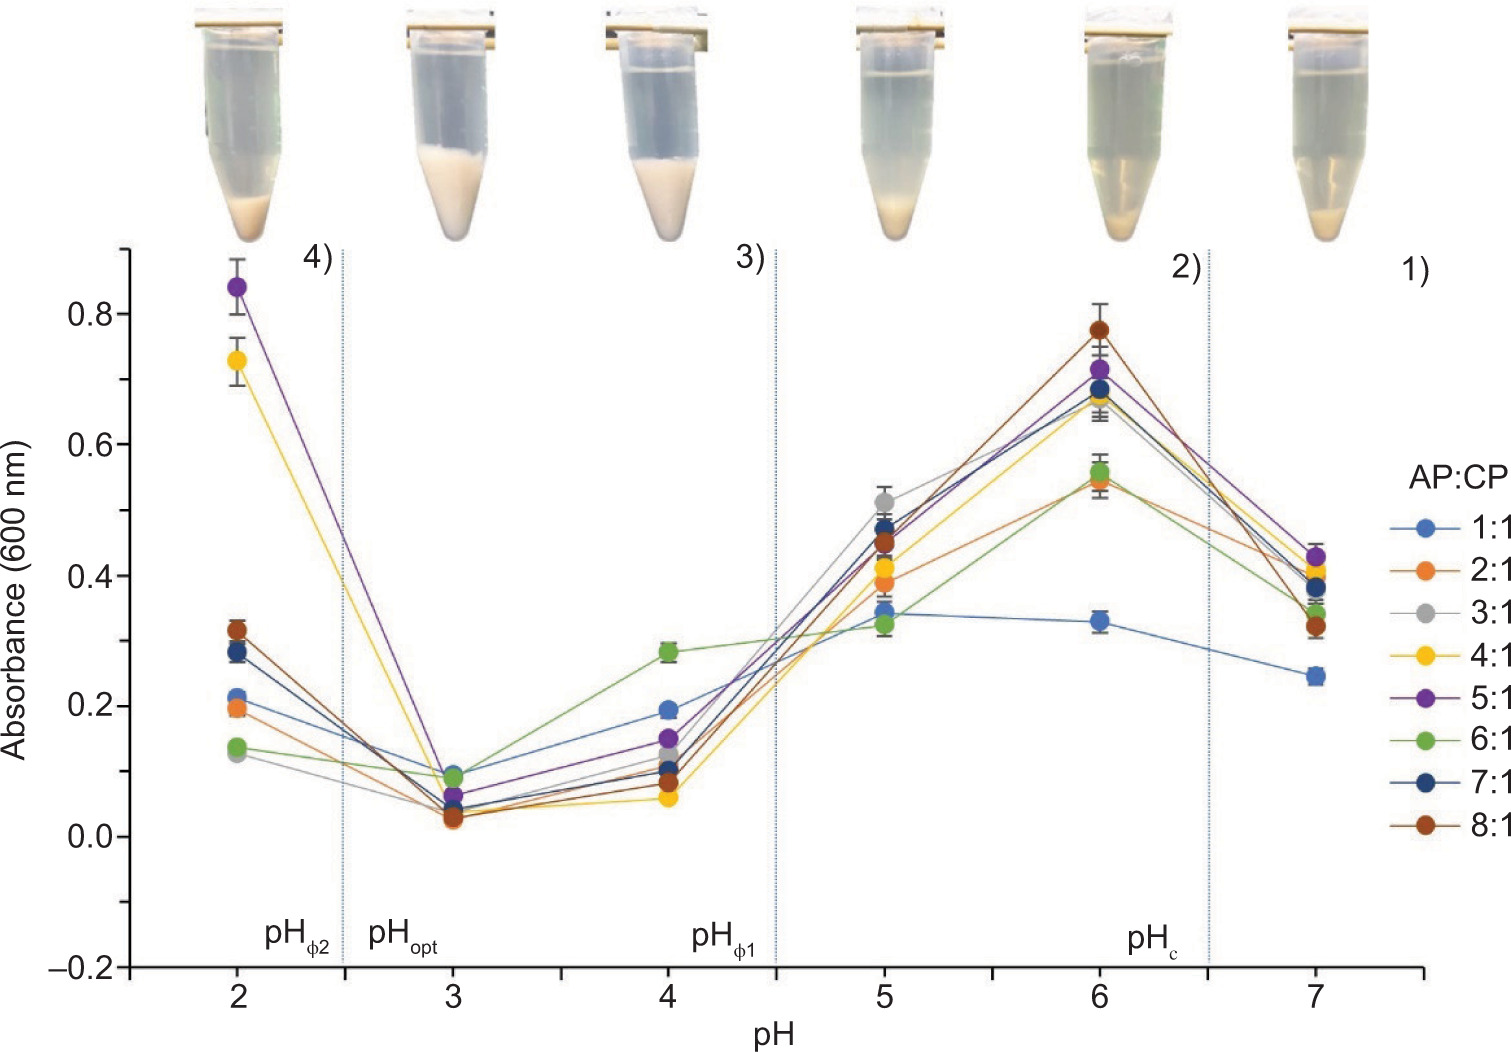
Turbidimetry is based on the ability of particles to absorb and scatter light that falls on them. Absorbance of a biopolymeric solution can be altered by changes in pH and concentration, which influence the surface charge of the particles, contributing to the formation and dissociation of soluble and insoluble complexes. Due to the above, there are changes in the mass’s size and the possible formation of aggregates or coacervates (Ghobadi et al., 2020). Therefore, when a system contains a higher number of suspended particles, a higher turbidity value is expected (Constantino and Garcia-Rojas, 2022). The absorbance values of the supernatants of the AP and CP binary complexes are shown in Figure 3. This was done in order to determine the most suitable weight ratio to be used between the two biopolymers for optimizing the yield and formation of binary coacervates, as a first step for subsequently establishing the formation of ternary complex coacervates as PE is added.
Figure 3. Change in the absorbance of supernatants from complex coacervates of amaranth protein (AP) and cacao pod husk pectin (CP) (1%, w/w) at different AP:CP ratios as a function of pH.
The profiles of the binary coacervates at 2:1 and 5:1 AP:CP weight ratios were similar and characterized by four distinct regions: 1) A region above pH 6.5, where AP and CP coexist without interacting due to strong electrostatic repulsion caused by the negative ζ-potential values of AP (-29.4 ± 0.5 mV) and CP (-48.0 ± 1.3 mV). 2) A region where soluble complexes begin to form at a critical pH of 6.5 (pHc) by binding AP molecules with CP chains, exhibiting a maximum absorbance value at pH 6. Although AP carries an overall negative charge at this pH, certain patches on the molecule contain positive charges due to -NH3+ moieties in the protein backbone that interact with negatively charged CP moieties. This implies that equilibrium phases with higher turbidity contain more macromolecules than translucent solutions (Espinosa-Andrews et al., 2007). 3) A region at pH values below 4.5 (pHɸ1), where greater amounts of AP molecules bind to CP chains as the positive charge density in the protein increases, leading to saturation of functional groups in CP chains and the beginning of aggregation into insoluble complexes. This results in charge neutralization, showing maximum phase separation at pH 3.0 (pHopt) (Ramírez-Santiago et al., 2012). 4) A region where, as the pH decreases further, a second critical pH (pHɸ2) is reached below 3.0; in this zone, insoluble complexes begin to dissociate into soluble complexes or even individual, non-interacting AP and CP molecules (Salminen and Weiss, 2013). This behavior can be attributed to the protonation of AP and CP functional groups, leading to the formation of a system with partially negative charges (Hashemi-Gahruie et al., 2022).
These results indicate that the optimal pH value for complex coacervates formation was 3.0, similar to that observed for the ζ-potential. The results showed that the most appropriate weight ratios for driving the interaction between AP:CP fell within the range of 2:1 to 5:1, whose supernatants exhibited significantly different lower absorbances between them (0.025 ± 0.002 to 0.062 ± 0.001, respectively), in contrast to the weight ratios of 1:1, 6:1, 7:1, and 8:1, which did not differ significantly from each other (Trujillo-Ramírez et al., 2018). Based on the above, the AP:CP weight ratios chosen for carrying out the turbidimetric studies were 2:1 and 5:1.
Complex coacervates yield
As already mentioned, initially binary complex coacervates (CC2:1/0.0 and CC5:1/0.0) were formed as a function of pH (2–7) to establish the most appropriate pH for driving complex coacervate formation between AP and CP (pH 3). Afterwards, to form the ternary complex coacervates, PE was added in different concentrations (0.1 and 0.5% w/v) to the AP:CP solutions at 2:1 and 5:1 weight ratios (pH ~ 6.2), and the pH of the ternary blend was adjusted to 3.
It was observed that as the AP:CP weight ratio increased from 2:1 to 5:1, the yield of the ternary complex coacervates increased significantly (Table 2). At either weight ratio, when PE was added at 0.5% w/v, a significant increase in yield occurred, but not when PE was added at 0.1% w/v. These results can probably be explained by interactions occurring between protein-polyphenol, protein-pectin, and polysaccharide-polyphenol. Rosenberg et al. (2024) reported that polysaccharides often have a greater abundance of charged groups (e.g., carboxyl) compared to proteins, which can lead to higher ionization and negative ζ-potential, whereas at high protein concentrations, protein-protein interactions become predominant. Xu et al. (2019) mentioned that protein-polyphenol interactions occur gradually, and when polyphenols are present in higher concentrations, more associations with proteins occur, leading to the formation of insoluble complexes. Chang et al. (2016) reported that protein-polysaccharide interactions occur at the pH of formation (in this case pH 3); when there are a larger number of protein molecules relative to polysaccharide molecules (e.g., 5:1 compared to 2:1 weight ratio), increased electrostatic interactions may occur between the biopolymers, leading to higher yield. Li et al. (2019) stated that polyphenol-polysaccharide interactions depend on the relative concentration of the molecules in solution and medium properties.
Table 2. Yield of ternary complex coacervates (CCa/b).
| CCa/b | Rendimiento (%) |
|---|---|
| CC2:1/0.0 | 52.3 ± 0.5d |
| CC2:1/0.1 | 53.8 ± 0.6d |
| CC2:1/0.5 | 56.8 ± 0.5c |
| CC5:1/0.0 | 59.1 ± 0.1b |
| CC5:1/0.1 | 59.7 ± 0.9b |
| CC5:1/0.5 | 61.7 ± 0.8a |
Values are presented as mean ± standard deviation. Different superscript letters indicate significant differences between means (p ≤ 0.05).
Fourier Transform Infrared spectroscopy (FTIR)
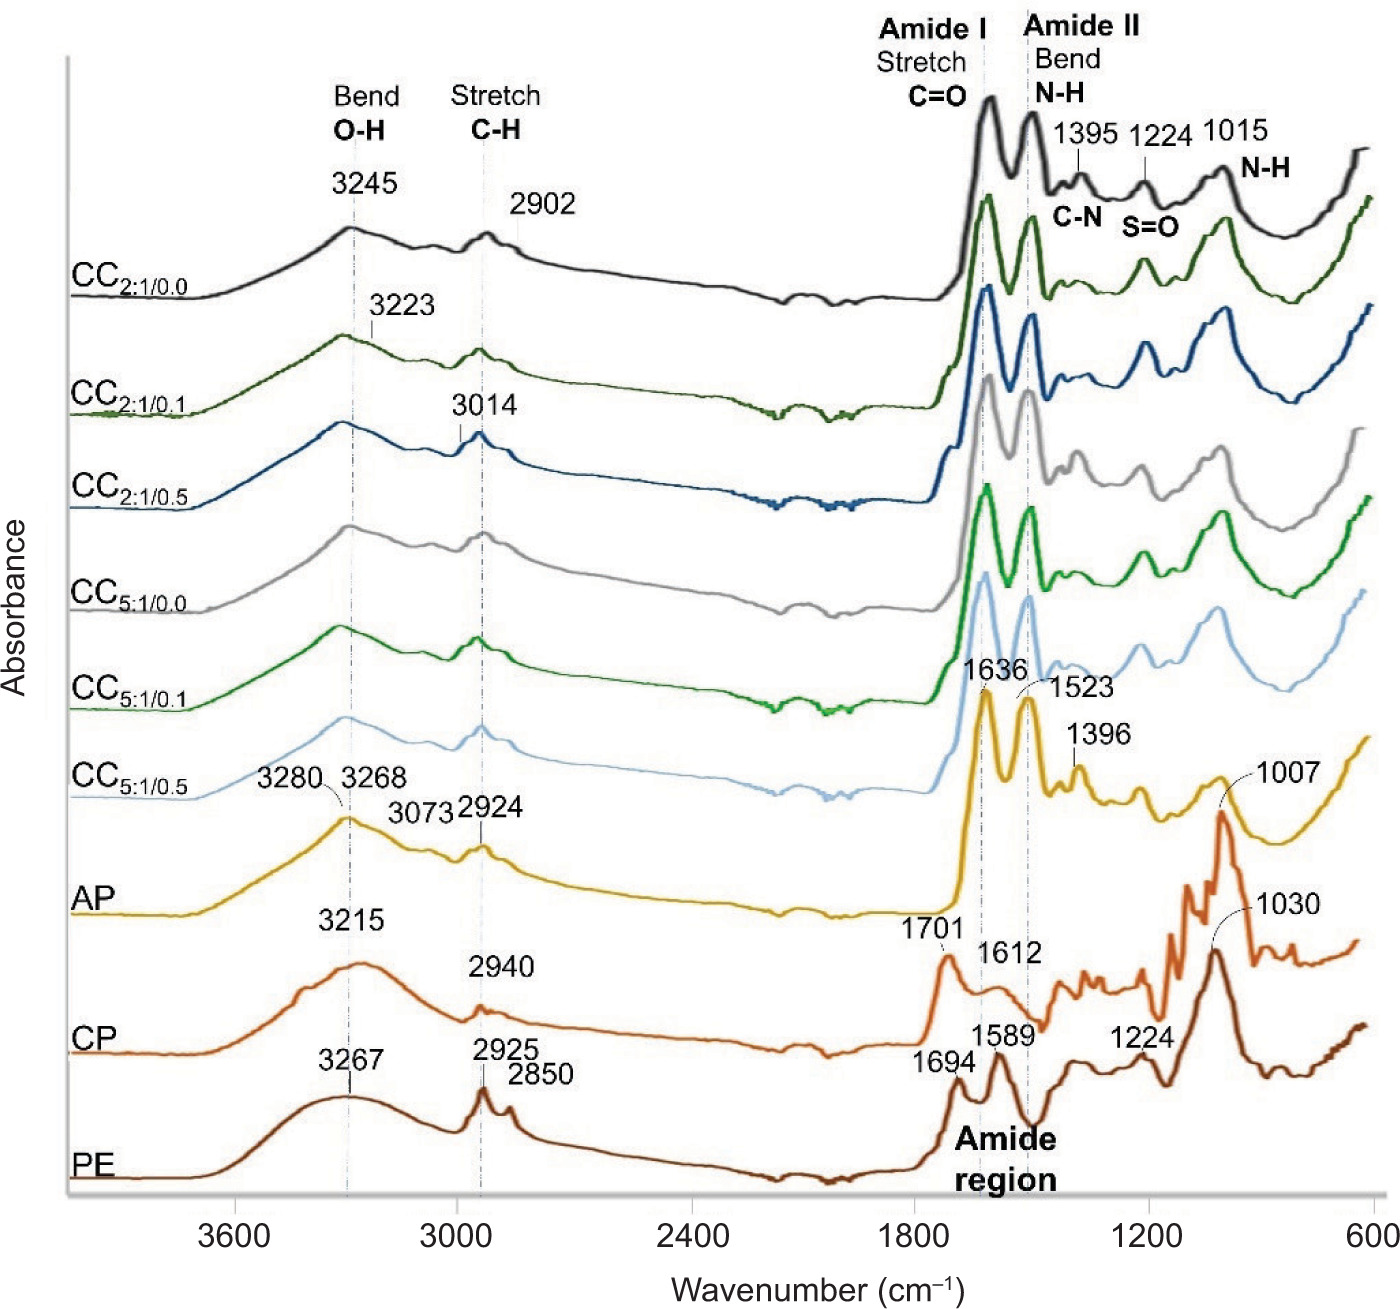
Figure 4 shows the FTIR spectra of AP, CP, PE, and the CCa/b variations. AP exhibited an absorption band at 3268 cm–1 corresponding to the contraction vibrations of O-H, attributed to hydrogen bonds present in the water. In addition, it presented a weak band at 3073 cm–1 appropriate for C-H stretch vibration and an N-H bond tension vibration band at 3280 cm–1 belonging to the amine B group (Raei et al., 2018). It also showed peaks at 1636, 1523, and 1396 cm–1 corresponding to the stretching and flexural bonds of C=O, N-H, and C-N characteristic of amides I, II, and III, respectively. The amide I region is considered helpful for the analysis of the secondary structure of proteins, as this structure is more susceptible to unfolding, folding, or aggregating, and its molecular interactions, chemical reactivity, and functional properties depend on it (Trujillo-Ramírez et al., 2018). CP had an absorption band at 3215 cm–1 corresponding to the vast stretch of the O-H bond and a stretch band of the C-O-C bond at 1007 cm–1 due to the hydrogen bonds of galacturonic acid (Lan et al., 2020). At 2940 cm–1, a peak was associated with stretching the C-H bond of methyl groups (-CH3). In addition, it had two peaks, one at 1701 and the other at 1612 cm–1, characteristic of the esterified carboxyl group (-COOCH3) and carboxylate group (-COO–), respectively, associated with the carbonyl group (C=O) present in carbohydrates (Raei et al., 2018). The PE spectrum exhibited a broad absorption band at 3267 cm–1, corresponding to the stretching of the O-H bond. In addition, it presented peaks at 2925 cm–1 and 2850 cm–1, corresponding to the stretching of the C-H bond, associated with the -CH2 and -CH3 groups, respectively; this indicates the presence of phenolic groups in the extract. Two peaks at 1589 and 1224 cm–1 were evidenced that can be attributed to aromatic rings (Eze et al., 2022), and a peak at 1693 cm–1 characteristic of the carboxyl group (-COOH), which indicates the presence of phenolic acids. Likewise, it exhibited a band at 1030 cm–1, typical of stretching the S=O bond, showing the presence of sulfur amino acids in the extract (Kashyap et al., 2022).
Figure 4. FTIR spectra of phenolic extract of cacao shell/husk (PE), cacao pod husk pectin (CP), amaranth protein isolate (AP), and ternary complex coacervates (CCa/b) with different AP:CP weight ratios and PE concentrations (a/b).
Electrostatic interactions between AP, CP, and PE can be observed in the fingerprint region of the spectrum (1400–600 cm–1), where peaks with different intensities and shifts in the AP, CP, and CCa/b spectra were shown. This can be seen as an increase at 1015 cm–1 corresponding to the vibration of the N-H bond (amide II) and at 1224 cm–1, which can be attributed to the vibration of the S=O bond of sulfur amino acids (Vargas et al., 2021). In addition, the band at 1395 cm–1 (C-N, amide III) decreased in CC without PE compared to AP. Similarly, in the amide I region (C=O), there was a decrease in the peak to 1694 cm–1 in all CCa/b spectra compared to AP and CP. Furthermore, there was an increase in the peak to 2902 cm–1 in CC5:1/0.5 concerning the PE spectrum, suggesting hydrogen bonds in the coacervates could increase due to PE. On the other hand, in the CCa/b variations, there were visible changes in the 3223 cm–1 peak that corresponds to the vibration of the N-H bonds of the proteins and in the 3014 cm–1 peak, due to the O-H bond of PE (Li et al., 2018). Based on the above, it can be inferred that the formation of the complex coacervates was a consequence of the electrostatic interaction between the ammonium (-NH3+) groups of AP, carboxylate groups (-COO–) of CP, and hydroxyl groups (-OH) of PE (You et al., 2018).
Microstructure and particle size
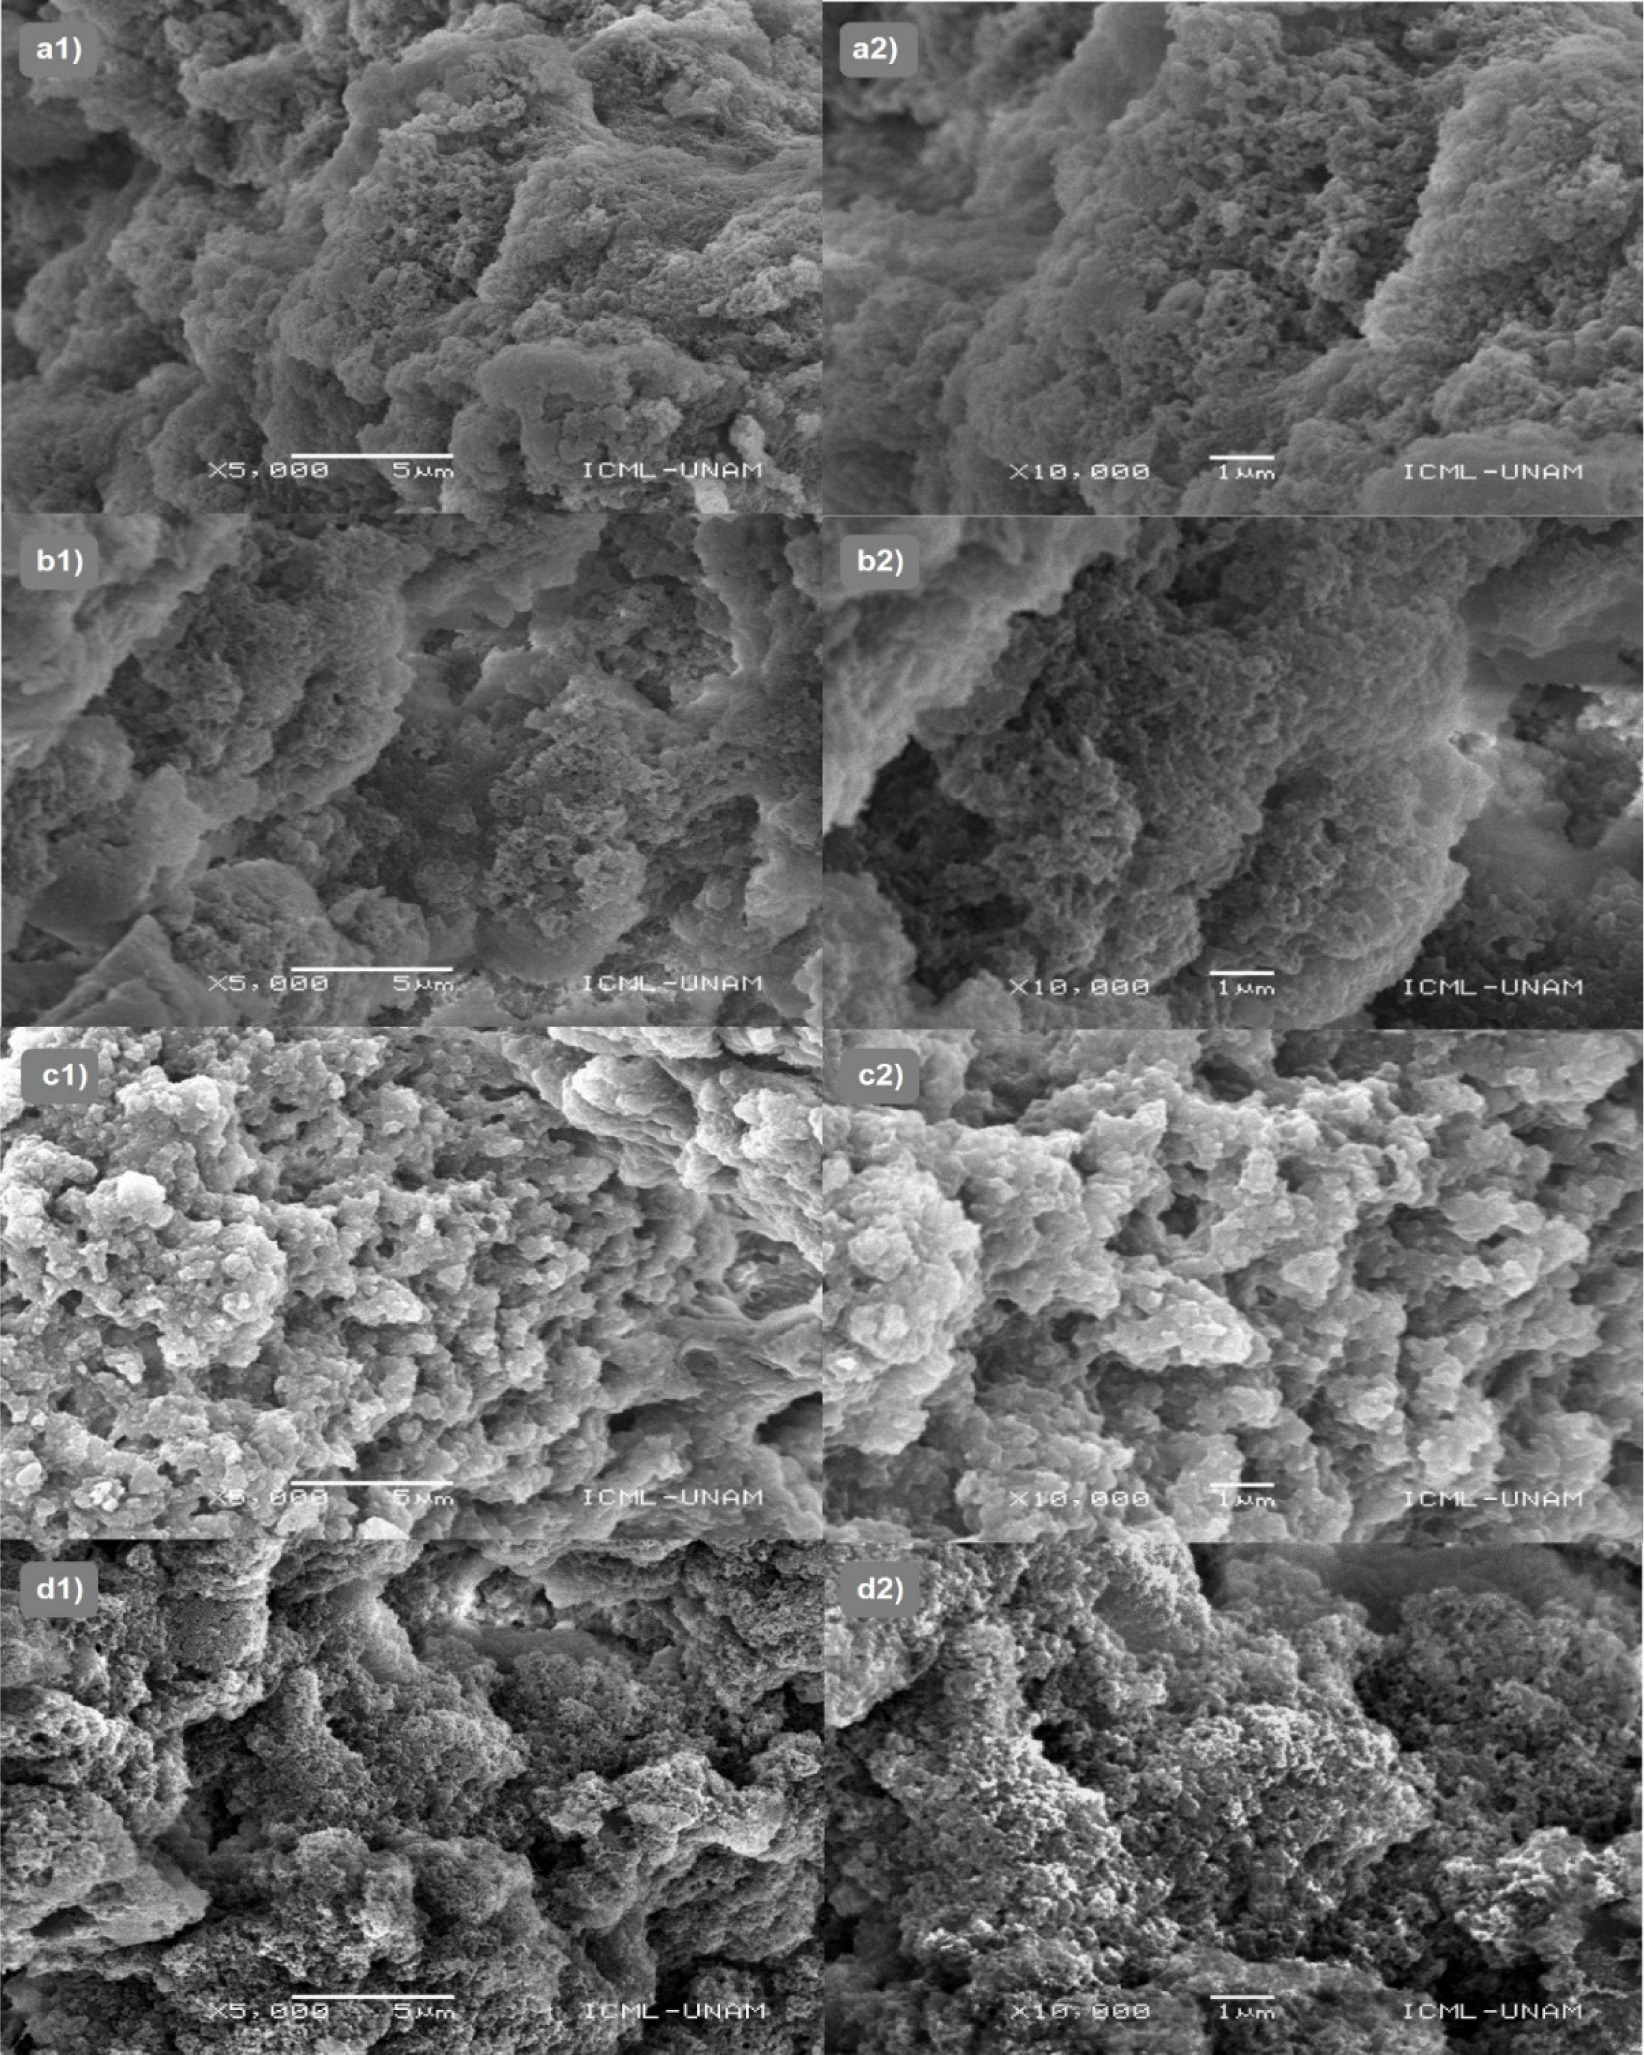
Figure 5 presents SEM micrographs of the CCa/b variations. The microstructure of protein-polysaccharide coacervates can be defined as a structural network where proteins act as binding sites and polysaccharide chains serve as cross-linking bridges. Furthermore, coacervates show a porous microstructure with different pore sizes and two distribution types (uniform or uneven). The size and distribution depend on the weight ratio and the number of bonds between the protein and the polysaccharide (R. Zhang et al., 2020). The morphology exhibited by the CCa/b showed the formation of a three-dimensional network with a heterogeneous and porous structure containing small aggregates.
Figure 5. SEM micrographs of ternary complex coacervate variations (CCa/b), with different AP:CP weight ratios (a/b): CC2:1/0.1 (a), CC2:1/0.5 (b), CC5:1/0.1 (c), CC5:1/0.5 (d). Magnifications: 5000× (1) and 10000× (2).
Colorimetry
According to the CIELAB system, the color parameters show coordinates that cover the entire color range perceived by the human eye, where: -a* = green, +a* = red, -b* = blue, +b* = yellow, L* = 0 to 100 (black/white), the angle of tone (H*) = 0 to 360° (red), 90° (yellow), 180° (green), 270° (blue), and saturation (C*) = 0 to 100 (Kuck and Noreña, 2016). Table 3 presents the results of the color parameters for the CCa/b variations. L* values ranged from 54.4 ± 0.2 to 61.1 ± 0.1, indicating that the samples presented a predominantly light color. CCa/b variations not containing PE had significantly higher L* values than those containing PE (CC2:1/0.1, CC2:1/0.5, CC5:1/0.1, and CC5:1/0.5). Values of a* and b* were positive, showing a tendency of the CCa/b to red and yellow, respectively.
Table 3. Chromatic parameters of ternary complex coacervates (CCa/b).
Different letters in the same column indicate significant differences between means (p ≤ 0.05).
Eze et al. (2022) mentioned that the concentration of PE could contribute to the decrease in luminosity and the increase in a* and b* values due to the color of anthocyanins present in the cacao pod husk and bean shell, which agrees with the findings of this work. H* values ranged from 72.6° to 84.8°, confirming that the color hue tended to be reddish yellow. C* values ranged from 10.7 to 14.5, indicating that all of the CCa/b variations exhibited rather muted color intensity, as observed by low saturation values.
Antioxidant activity
Cacao by-products are rich in polyphenols, which have antioxidant properties that help prevent oxidative damage to cells (Zhang et al., 2024). TPC (expressed as GAE) results of cacao pod husk and cacao bean shell extracts were 53.7 ± 2.1 mg/g and 86.4 ± 4.1 mg/g, respectively. Cantele et al. (2020) reported that the TPC of cacao bean shells ranged from 3.12 to 94.95 mg/g. On the other hand, the cacao pod husk had a TPC between 46.0 and 57.0 mg/g (Campos-Vega et al., 2018). Therefore, the data obtained are within the ranges mentioned above. TPC for the mixture of cacao shell and husk extracts (PE) was determined, obtaining a value of 70.7 ± 2.5 mg/g.
Table 4 shows phenolic compounds identified in PE by GC-MS analysis, along with other compounds such as caffeine and theobromine, which have antioxidant and anti-inflammatory properties, a positive effect on mood, and influence on alertness. The phenolic compounds identified possess biological properties due to their ability to donate electrons and hydrogens. Some compounds, such as protocatechuic acid, pyrogallol, and vanillic acid, exhibit antioxidant and antimicrobial activity (Zhang et al., 2024).
Table 4. Antioxidant compounds identified in the phenolic extract (PE).
| Compound* | RT (min) | MW (g/mol) | Molecular ion/(m/z) | Fragmented ions/(m/z) | Molecular formula |
|---|---|---|---|---|---|
| Catechol | 11.9 | 110.1 | 207 | 75, 117, 147, 151, 167, 169 | C6H6O2 |
| 4-Metilcatechol | 15.2 | 124.1 | 269 | 147, 207, 253, 268 | C7H8O2 |
| Hydroquinone | 15.4 | 110.1 | 254 | 73, 75, 131, 147, 207, 239 | C6H6O2 |
| Isovanillin | 17.5 | 152.1 | 312 | 149, 165, 223 | C8H8O3 |
| Pyrogallol | 17.7 | 126.1 | 343 | 73, 147, 239, 240, 241, 327, 342 | C6H6O3 |
| 3-hydroxybenzoic acid | 18.7 | 138.1 | 282 | 75, 193, 267, 268 | C7H6O3 |
| 4-hydroxybenzoic acid | 18.8 | 138.1 | 312 | 193, 207, 223, 267, 268 | C7H6O3 |
| Vanillic acid | 20.7 | 168.1 | 297 | 73, 207, 223, 253, 267, 282 | C8H8O4 |
| Protocatechuic acid | 21.5 | 154.1 | 371 | 73, 193, 194, 281, 311, 355, 370 | C7H6O4 |
| Caffeine | 22.1 | 194.1 | 195 | 82, 109, 165, 194 | C8H10N4O2 |
| Theobromine | 21.8 | 180.1 | 181 | 82, 109, 137, 180 | C7H8N4O2 |
*Derivative TMS. Source: Authors’ creation. PE= cacao shell/husk phenolic extract. RT=retention time. MW=molecular mass. m/z= mass-to-charge ratio.
Table 5 presents the TPC (expressed as GAE), ABTS+, and DPPH• values displayed by the CCa/b variations, PEfree (PE 0.5%, w/v), AP, and CP. It is worth mentioning that Castel et al. (2014) noted that the TPC for Amaranthus spp. depended on the extraction method, ranging from 0.01 to 3.0 mg/g. On the other hand, Nieto-Figueroa et al. (2020) reported that TPC values for CP ranged from 24 to 27 mg/g. In relation to the above, AP and CP had a low inhibition % of ABTS+ compared to PEfree. It is important to highlight that the TPC values obtained from AP and CP were subtracted from their respective systems so as not to overestimate the antioxidant capacity of PE. TPC values increased from 4.3 ± 0.1 to 35.9 ± 0.2 mg/g as the PE concentration increased from 0.0 to 0.5% (w/v) and the weight ratio AP:CP increased from 2:1 to 5:1.
Table 5. Total phenolic content (TPC), ABTS+, and DPPH• percentage inhibition of complex coacervates (CCa/b), phenolic extract (PE), amaranth protein isolate (AP), and cacao husk pectin (CP).
| Sample | TPC (GAE (mg/g)) | ABTS+(%) | DPPH•(%) |
|---|---|---|---|
| CC2:1/0.0 | 4.3 ± 0.1h | 6.6 ± 0.2f | 15.1 ± 0.7e |
| CC2:1/0.1 | 11.2 ± 0.2f | 30.7 ± 0.8b | 37.7 ± 0.9b |
| CC2:1/0.5 | 26.8 ± 0.3c | 33.6 ± 0.8a | 49.8 ± 1.7a |
| CC5:1/0.0 | 9.1 ±0.1g | 12.2 ± 0.5d | 32.5 ± 1.3c |
| CC5:1/0.1 | 19.2 ± 0.1e | 32.9 ± 0.7a | 37.1 ± 0.9b |
| CC5:1/0.5 | 35.9 ± 0.2b | 35.0 ± 0.7a | 52.7 ± 2.2a |
| PEfree | 46.6 ± 0.3a | 34.9 ± 0.7a | 49.8 ± 0.9a |
| AP | 1.8 ± 0.2i | 9.5 ± 1.5e | 20.3 ± 1.7d |
| CP | 23.1 ± 0.4d | 16.5 ± 0.3c | 38.5 ± 0.3b |
Values are presented as mean ± standard deviation. Different letters on the same column indicate significant differences between means (p ≤ 0.05). GAE=gallic acid equivalents.
CCa/b variations’ DPPH• inhibition % values were higher, ranging from 15.1 ± 0.7 to 52.7 ± 2.2%, as the AP:CP weight ratio increased from 2:1 to 5:1 and the PE concentration increased from 0.0 to 0.5% (w/v). Kuck and Noreña (2016) microencapsulated phenolic extract of grape skin using gum Arabic, partially hydrogenated guar gum, and polydextrose as encapsulating agents, reporting inhibition % values between 45.4 and 59.1%, suggesting that an increase in the concentration of the phenolic extract enhances antioxidant capacity.
CCa/b variations’ ABTS+ inhibition % increased from 6.6 ± 0.2 (CC2:1/0.0) to 35.0 ± 0.7 (CC5:1/0.5) as the AP:CP weight ratio increased from 2:1 to 5:1 and the PE concentration increased from 0.0 to 0.5% (w/v). Constantino and Garcia-Rojas (2022) reported similar findings in amaranth protein-carboxymethylcellulose coacervates used for encapsulating ethanolic extracts of betanin. They found that increasing the weight ratio of the encapsulating material, as well as the concentration of phenolic compounds, significantly enhanced antioxidant activity.
Both DPPH• and ABTS+ inhibition % values showed a similar trend dependent on PE concentration, likely due to the reducing properties of phenolic compounds, which act by donating hydrogen atoms to interrupt free radical reactions (Kashyap et al., 2022).
Conclusions
A high yield of high methoxyl pectin was obtained from agro-industrial cacao residues, meeting the requirements for commercial applications. The formation of coacervates between AP, CP, and PE is influenced by two key factors: the weight ratio AP:CP and the concentration of PE. These factors play a crucial role in determining the physicochemical and functional properties of CCa/b. As the AP:CP weight ratio increased, the resulting coacervates exhibited higher yield and larger particle size. CCa/b showed a tendency toward red and yellow hues due to the color of phenolic compounds present in PE. Additionally, phenolic compounds with antioxidant properties were identified in PE. High inhibition % values of DPPH• and ABTS+ were observed in CCa/b as the PE concentration increased from 0.0 to 0.5% (w/v). Based on these findings, and considering their physicochemical characteristics, this study provides a new and broad perspective on the application of ternary complex coacervates as viable ingredients in the development of new foods—particularly those with shades of low red and yellow saturation—such as sauces, creams, yogurt, butter, and mayonnaise, while also supplying antioxidants and high-quality protein.
Acknowledgements
Authors thank the Secretaría de Ciencia, Humanidades, Tecnologías e Innovación (SECIHTI) of Mexico for financial support for the Ph. D. scholarship of K. García-de la Rosa. They also reiterate their gratitude to MC. Laura Elena Gómez Lizárraga from the Instituto de Ciencias del Mar y Limnología de la Universidad Nacional Autónoma de México (UNAM) for the support provided in obtaining SEM images.
Authors Contribution
L. Hernández-Rodríguez and K. García-de la Rosa conceived and designed the experiments. K. García-de la Rosa performed the experiments, analyzed the data, wrote and revised the draft of the manuscript. L. Hernández-Rodríguez supervised the research and was instrumental in editing the manuscript. L. Hernández-Rodríguez, C. Lobato-Calleros, J.C. Cuevas-Bernardino, E.J. Vernon-Carter participated in the critical review, editing, and approval of the final manuscript.
Conflict of Interest
The authors declare that there are no conflicts of interest with respect to this research or publication of this article.
Funding
None.
REFERENCES
Adegbaju, O. D., Otunola, G. A., & Afolayan, A. J. (2020). Effects of growth stage and seasons on the phytochemical content and antioxidant activities of crude extracts of Celosia argentea L. Heliyon, 6(6), e04086. 10.1016/j.heliyon.2020.e04086
AOAC. (1996). Official methods of analysis (16th ed.). AOAC International.
Banjare, I. S., Gandhi, K., Sao, K., & Sharma, R. (2019). Spray-dried whey protein concentrate-iron complex: Preparation and physicochemical characterization. Food Technology and Biotechnology, 57(3), 331–340. 10.17113/ftb.57.03.19.6228
Campos-Vega, R., Nieto-Figueroa, K. H., & Oomah, B. D. (2018). Cocoa (Theobroma cacao L.) pod husk: Renewable source of bioactive compounds. Trends in Food Science & Technology, 81, 172–184. 10.1007/s11694-021-01228-7
Cantele, C., Rojo-Poveda, O., Bertolino, M., Ghirardello, D., Cardenia, V., Barbosa-Pereira, L., & Zeppa, G. (2020). In vitro bioaccessibility and functional properties of phenolic compounds from enriched beverages based on cocoa bean shell. Foods, 9(6), Article 715. 10.3390/foods9060715
Castel, V., Andrich, O., Netto, F. M., Santiago, L. G., & Carrara, C. R. (2014). Total phenolic content and antioxidant activity of different streams resulting from pilot-plant processes to obtain Amaranthus mantegazzianus protein concentrates. Journal of Food Engineering, 122, 62–67. 10.1016/j.jfoodeng.2013.08.032
Chang, P. G., Gupta, R., Timilsena, Y. P., & Adhikari, B. (2016). Optimisation of the complex coacervation between canola protein isolate and chitosan. Journal of Food Engineering, 191, 58–66. 10.1016/j.jfoodeng.2016.07.008
Constantino, A. B. T., & Garcia-Rojas, E. E. (2022). Microencapsulation of betanin by complex coacervation of carboxymethylcellulose and amaranth protein isolate for application in edible gelatin films. Food Hydrocolloids, 133, 107956. 10.1016/j.foodhyd.2022.107956
Cortés-Viguri, V., Hernández-Rodríguez, L., Lobato-Calleros, C., Cuevas-Bernardino, J. C., Hernández-Rodríguez, B. E., Alvarez-Ramirez, J., & Vernon-Carter, E. J. (2021). Annatto (Bixa orellana L.), a potential novel starch source: Antioxidant, microstructural, functional, and digestibility properties. Journal of Food Measurement and Characterization, 16(1), 637–651. 10.1007/s11694-021-01228-7
de Souza, V. B., Thomazini, M., Echalar Barrientos, M. A., Nalin, C. M., Ferro-Furtado, R., Genovese, M. I., & Favaro-Trindade, C. S. (2018). Functional properties and encapsulation of a proanthocyanidin-rich cinnamon extract (Cinnamomum zeylanicum) by complex coacervation using gelatin and different polysaccharides. Food Hydrocolloids, 77, 297–306. 10.1016/j.foodhyd.2017.09.040
Espinosa-Andrews, H., Báez-González, J. G., Cruz-Sosa, F., & Vernon-Carter, E. J. (2007). Gum arabic-chitosan complex coacervation. Biomacromolecules, 8(4), 1313–1318. 10.1021/bm0611634
Eze, F. N., Jayeoye, T. J., & Singh, S. (2022). Fabrication of intelligent pH-sensing films with antioxidant potential for monitoring shrimp freshness via the fortification of chitosan matrix with broken riceberry phenolic extract. Food Chemistry, 366, Article 130574. 10.1016/j.foodchem.2021.130574
Figueroa-González, J. J., Lobato-Calleros, C., Vernon-Carter, E. J., Aguirre-Mandujano, E., López-Monterrubio, D. I., & Alvarez-Ramirez, J. (2025). Physicochemical characterization and in vitro digestibility of modified amaranth protein/octenyl succinic anhydride-modified corn starch insoluble complexes. Acta Scientiarum Polonorum Technologia Alimentaria, 24(1), 47–65. 10.17306/J.AFS.001268
Gaber-Ahmed, G. H., Fernández-González, A., & Díaz García, M. E. (2020). Nano-encapsulation of grape and apple pomace phenolic extract in chitosan and soy protein via nanoemulsification. Food Hydrocolloids, 108, 105806. 10.1016/j.foodhyd.2020.105806
García-de la Rosa, K., Lobato-Calleros, C., Hernández-Rodríguez, L., & Aguirre-Mandujano, E. (2023). Rheological and structural properties of complex coacervates of Amaranthus hypochondriacus protein-citrus pectin. Revista Mexicana de Ingeniería Química, 22(1), 1–18. 10.24275/rmiq/Alim3003
Ghobadi, M., Koocheki, A., Varidi, M. J., & Varidi, M. (2020). Fabrication and characterization of Grass pea (Lathyrus sativus) protein isolate–Alyssum homolocarpum seed gum complex coacervate. Polymer Testing, 89, 106636. 10.1016/j.polymertesting.2020.106636
Hadidi, M., Aghababaei, F., Mahfouzi, M., Zhang, W., & McClements, D. J. (2024). Amaranth proteins: From extraction to application as nanoparticle-based delivery systems for bioactive compounds. Food Chemistry, 439, 138164. 10.1016/j.foodchem.2023.138164
Hashemi-Gahruie, H., Mirzapour, A., Ghiasi, F., Eskandari, M. H., Moosavi-Nasab, M., & Hosseini, S. M. H. (2022). Development and characterization of gelatin and Persian gum composite edible films through complex coacervation. LWT–Food Science and Technology, 153, 112422. 10.1016/j.lwt.2021.112422
Hernández-Rodríguez, L., Lobato-Calleros, C., Pimentel-González, D. J., & Vernon-Carter, E. J. (2014). Lactobacillus plantarum protection by entrapment in whey protein isolate: κ-carrageenan complex coacervates. Food Hydrocolloids, 36, 181–188. 10.1016/j.foodhyd.2013.09.018
Huang, X., Huang, X., Gong, Y., Xiao, H., McClements, D. J., & Hu, K. (2016). Enhancement of curcumin water dispersibility and antioxidant activity using core-shell protein-polysaccharide nanoparticles. Food Research International, 87, 1–9. 10.1016/j.foodres.2016.06.009
Hutomo, G. S., Rahim, A., & Kadir, S. (2016). Pectin isolation from dry pod husk cocoa with hydrochloride acid. International Journal of Current Microbiology and Applied Sciences, 5(11), 751–756. 10.20546/ijcmas.2016.511.086
Kashyap, P., Riar, C. S., & Jindal, N. (2022). Effect of extraction methods and simulated in vitro gastrointestinal digestion on phenolic compound profile, bio-accessibility, and antioxidant activity of Meghalayan cherry (Prunus nepalensis) pomace extracts. LWT–Food Science and Technology, 153, 112570. 10.1016/j.lwt.2021.112570
Kim, M. J., Ju, H. K., Kim, Y., Yoo, S.-H., & Kim, Y.-S. (2016). Effects of amidation and/or methylesterification of pectin on aroma release at different calcium concentration. Food Hydrocolloids, 52, 343–349. 10.1016/j.foodhyd.2015.07.006
Koralegedara, I. D., Hettiarachchi, C. A., Prasantha, B. D. R., & Wimalasiri, K. M. S. (2020). Synthesis of nano-scale biopolymer particles from legume protein isolates and carrageenan. Food Technology and Biotechnology, 58(2), 214–222. 10.17113/ftb.58.02.20.6279
Kuck, L. S., & Noreña, C. P. (2016). Microencapsulation of grape (Vitis labrusca var. Bordo) skin phenolic extract using gum Arabic, polydextrose, and partially hydrolyzed guar gum as encapsulating agents. Food Chemistry, 194, 569–576. 10.1016/j.foodchem.2015.08.066
Lan, Y., Ohm, J.-B., Chen, B., & Rao, J. (2020). Phase behavior, thermodynamic and microstructure of concentrated pea protein isolate-pectin mixture: Effect of pH, biopolymer ratio and pectin charge density. Food Hydrocolloids, 101, 105556. 10.1016/j.foodhyd.2019.105556
Li, R., Zeng, Z., Fu, G., Wan, Y., Liu, C., & McClements, D. J. (2019). Formation and characterization of tannic acid/beta-glucan complexes: Influence of pH, ionic strength, and temperature. Food Research International, 120, 748–755. 10.1016/j.foodres.2018.11.034
Li, Y., Zhang, X., Sun, N., Wang, Y., & Lin, S. (2018). Formation and evaluation of casein-gum arabic coacervates via pH-dependent complexation using fast acidification. International Journal of Biological Macromolecules, 120(Pt A), 783–788. 10.1016/j.ijbiomac.2018.08.145
Malvern Instruments Limited. (2015). Zeta potential—An introduction in 30 minutes (Technical Note). https://www.research.colostate.edu/wp-content/uploads/2018/11/ZetaPotential-Introduction-in-30min-Malvern.pdf
Manzano, P., Hernández, J., Quijano-Avilés, M., Barragán, A., Chóez-Guaranda, I., Viteri, R., & Valle, O. (2017). Polyphenols extracted from Theobroma cacao waste and its utility as antioxidant. Emirates Journal of Food and Agriculture, 29(1), 45–50. 10.9755/ejfa.2016-04-388
Muhoza, B., Xia, S., Wang, X., & Zhang, X. (2020). The protection effect of trehalose on the multinuclear microcapsules based on gelatin and high methyl pectin coacervate during freeze-drying. Food Hydrocolloids, 105, 105807. 10.1016/j.foodhyd.2021.107239
Murcia, K. S., & Castañeda, M. d. R. (2022). Evaluation of the content of total phenols and antioxidant capacity of ethanolic extracts of cocoa shell (Theobroma cacao L.). Revista de Investigación Agraria y Ambiental, 13(2), 53–65. 10.22490/21456453.4717
Nieto-Figueroa, K. H., Mendoza-Garcia, N. V., Gaytan-Martinez, M., Wall-Medrano, A., Guadalupe Flavia Loarca-Pina, M., & Campos-Vega, R. (2020). Effect of drying methods on the gastrointestinal fate and bioactivity of phytochemicals from cocoa pod husk: In vitro and in silico approaches. Food Research International, 137, 109725. 10.1016/j.foodres.2020.109725
Pan-Utai, W., & Iamtham, S. (2020). Enhanced microencapsulation of C-Phycocyanin from Arthrospira by freeze-drying with different wall materials. Food Technology and Biotechnology, 58(4), 423–432. 10.17113/ftb.58.04.20.6622
Raei, M., Rafe, A., & Shahidi, F. (2018). Rheological and structural characteristics of whey protein-pectin complex coacervates. Journal of Food Engineering, 228, 25–31. 10.1016/j.jfoodeng.2018.02.007
Ramírez-Santiago, C., Lobato-Calleros, C., Espinosa-Andrews, H., & Vernon-Carter, E. J. (2012). Viscoelastic properties and overall sensory acceptability of reduced-fat Petit-Suisse cheese made by replacing milk fat with complex coacervate. Dairy Science & Technology, 92(4), 383–398. 10.1007/s13594-012-0077-2
Rosenberg, A., Solomonov, A., Cohen, H., Eliaz, D., Kellersztein, I., Brookstein, O., Kozell, A., Wang, L., Wagner, H. D., Daraio, C., & Shimanovich, U. (2024). From basic principles of protein–polysaccharide association to the rational design of thermally sensitive materials. ACS Applied Materials & Interfaces, 16(7), 9210–9223. 10.1021/acsami.3c12926
Salminen, H., & Weiss, J. (2014). Effect of pectin type on association and pH stability of whey protein-pectin complexes. Food Biophysics, 9(1), 29–38. 10.1007/s11483-013-9314-3
Shahidi, F., & Senadheera, R. (2019). Protein–phenol interactions. In L. Melton, F. Shahidi, & R. Senadheera (Eds.), Encyclopedia of food chemistry (pp. 532–538). Academic Press.
SIAP. (2023). Progress of sowing and harvesting, summary by state. Mexico: Agri-Food and Fisheries Information Service. https://nube.agricultura.gob.mx/cierre_agricola/
Trujillo-Ramírez, D., Lobato-Calleros, C., Román-Guerrero, A., Hernández-Rodríguez, L., Alvarez-Ramirez, J., & Vernon-Carter, E. J. (2018). Complexation with whey protein hydrolysate improves cacao pod husk pectin surface active and emulsifying properties. Reactive and Functional Polymers, 123, 61–69. 10.1016/j.reactfunctpolym.2017.12.011
Vargas, S. A., Delgado-Macuil, R. J., Ruiz-Espinosa, H., Rojas-Lopez, M., & Amador-Espejo, G. G. (2021). High-intensity ultrasound pretreatment influence on whey protein isolate and its use on complex coacervation with kappa carrageenan: Evaluation of selected functional properties. Ultrasonics Sonochemistry, 70, 105340. 10.1016/j.ultsonch.2020.105340
Ventureira, J. L., Bolontrade, A. J., Speroni, F., David-Briand, E., Scilingo, A. A., Ropers, M.-H., Boury, F., Añón, M. C., & Anton, M. (2012). Interfacial and emulsifying properties of amaranth (Amaranthus hypochondriacus) protein isolates under different conditions of pH. LWT-Food Science and Technology, 45(1), 1–7. 10.1016/j.lwt.2011.07.024
Vriesmann, L. C., Teófilo, R. F., & de Oliveira Petkowicz, C. L. (2012). Extraction and characterization of pectin from cacao pod husks (Theobroma cacao L.) with citric acid. LWT–Food Science and Technology, 49(1), 108–116. 10.1016/j.lwt.2012.04.018
Wang, C., Sun, C., Lu, W., Gul, K., Mata, A., & Fang, Y. (2020). Emulsion structure design for improving the oxidative stability of polyunsaturated fatty acids. Comprehensive Reviews in Food Science and Food Safety, 19(6), 2955–2971. 10.1111/1541-4337.12621
Xu, Z., Hao, N., Li, L., Zhang, Y., Yu, L., Jiang, L., & Sui, X. (2019). Valorization of soy whey wastewater: How epigallocatechin-3-gallate regulates protein precipitation. ACS Sustainable Chemistry & Engineering, 7(18), 15504–15513. 10.1021/acssuschemeng.9b03208
Yao, W., Lei, Z., Fu, S., Zhong, J., & Liu, C. (2019). Effects of addition sequence on structure and function of β-lactoglobulin-EGCG-glucose ternary complexes. Food Science, 40, 41–47. 10.7506/spkx1002-6630-20180814-132.
Yan, S., Regestein, J. M., Qi, B., & Li, Y. (2023). Construction of protein-polysaccharide-and polyphenol-based conjugates as delivery systems. Critical Reviews in Food Science and Nutrition, 65(7), 1–19. 10.1080/10408398.2023.2293253
Yang, X., Yuan, K., Descallar, F. B. A., Li, A., Yang, X., & Yang, H. (2022). Gelation behaviors of some special plant-sourced pectins: A review inspired by examples from traditional gel foods in China. Trends in Food Science & Technology, 126, 26–40. 10.1016/j.tifs.2022.06.012
You, G., Liu, X. L., & Zhao, M. M. (2018). Preparation and characterization of hsian-tsao gum and chitosan complex coacervates. Food Hydrocolloids, 74, 255–266. 10.1016/j.foodhyd.2017.08.004
Zhang, M., Zhang, H., Jia, L., Zhang, Y., Qin, R., Xu, S., & Mei, Y. (2024). Health benefits and mechanisms of theobromine. Journal of Functional Foods, 115, 106126. 10.1016/j.jff.2024.106126
Zhang, Q., Dong, H., Gao, J., Chen, L., & Vasanthan, T. (2020). Field pea protein isolate/chitosan complex coacervates: Formation and characterization. Carbohydrate Polymers, 250, 116925. 10.1016/j.carbpol.2020.116925
Zhang, R., Belwal, T., Li, L., Lin, X., Xu, Y., & Luo, Z. (2020). Recent advances in polysaccharides stabilized emulsions for encapsulation and delivery of bioactive food ingredients: A review. Carbohydrate Polymers, 242, 116388. 10.1016/j.carbpol.2020.116388
Zhao, M., Xia, X., Mao, J., Wang, C., Dawadi, M. B., Modarelli, D. A., & Zacharia, N. S. (2019). Composition and property tunable ternary coacervate: Branched polyethylenimine and a binary mixture of a strong and weak polyelectrolyte. Molecular Systems Design & Engineering, 4, 110-121. 10.1039/C8ME00069G