
Download

ORIGINAL ARTICLE
Tocols and fatty acids as markers of the origin of vegetable oils and fats in bakery products
Alessandra Fratianni1*, Serena Niro1, Annacristina D’Agostino1, Riccardo Ievoli2, Pasquale Avino1, Ivan Notardonato1, Gianfranco Panfili1
1Department of Agricultural, Environmental and Food Sciences, University of Molise, via De Sanctis, Campobasso, Italy;
2University of Ferrara, via Luigi Borsari 11, Ferrara, Italy
Abstract
This study reports an approach combining the use of tocols and fatty acids as variables to separate different bakery products with respect to the oil/fat used as ingredients. The tocol and fatty acid profiles were investigated in 12 biscuits prepared with different fats/oils. Based on different profiles, principal component analysis (PCA) was used to classify samples according to their fat/oil ingredients. The PCA found three components that are able to explain approximately 71% of total variance, and it proved useful in characterizing products. The tested approach was validated on 33 commercial bakery products prepared with different fats/oils to verify the information mentioned on food labels.
Key words: bakery products, biscuits, fats, fatty acids, principal component analysis, tocols
*Corresponding author: Alessandra Fratianni, Department of Agricultural, Environmental and Food Sciences, University of Molise via De Sanctis 86100, Campobasso, Italy. Email: [email protected]
Received: 1 August 2024; Accepted: 8 September 2024; Published: 23 October 2024
© 2024 Codon Publications
This is an Open Access article distributed under the terms of the Creative Commons Attribution-NonCommercial-ShareAlike 4.0 International (CC BY-NC-SA 4.0). License (http://creativecommons.org/licenses/by-nc-sa/4.0/)
Introduction
Oils and fats play an important role in bakery products, and some products’ shelf life and sensory characteristics are strongly dependent on the type and content of fats used (Chen et al., 2024). Animal fats, such as lard fat (LF) and butter fat (BF), and vegetable oils are often used in the production of products by the bakery industry. The widely used oils/fats are manufactured shortenings, butter oil (BO), palm oil (PO) and margarines, in which contents of saturated and, in some cases, trans-fatty acids (TFAs) are high (Ghotra et al., 2002). In this context, PO is a very popular fat, free from TFAs, with desirable physical properties (Wong and Radhakrishnan, 2012). However, in the last few years, use of this fat by the food industry as well as consumers has been criticized for its supposed negative effects on human health and the environment (Gambelli and Logman, 2015; Hrncirik and Van Duijn, 2011); hence, PO has become a ‘specially monitored ingredient’ (Greenpeace, 2018). These factors, together with increase in consumer demand for healthier foods, have led the food industry to replace PO in the recipes, and the ‘no palm oil” logo became a powerful marketing tool. Prior to the application of Regulation (EU) No. 1169/2011 (European Union, 2011), the generic term ‘vegetable oils’ was used on the labels on food products prepared with oil blends. However, from December 2014, according to the Regulation (EU) No 1169/2011 (European Union, 2011), the typology of fats/oils used in food products must be specified on the label.
With the aim to identify the addition of different fats/oils in olive oil (OO) and the origin of fats/oils in food products, two distinctive methodologies are reported (Meenu et al., 2019; Osorio et al., 2014). One methodology focuses on employing instrumental non-separative/non-destructive techniques (‘non-targeted methods’), such as Raman spectroscopy, Fourier transform infrared spectroscopy (FTIR) (Rohman et al., 2020), mid-infrared spectroscopy, near-infrared spectroscopy (NIR), and nuclear magnetic resonance (NMR), which assume a multivariate depiction of the chemical and physical composition of samples under investigation (Ray et al., 2022). The second methodology is based on the separation and detection of specific chemical marker compounds (Costa et al., 2019), such as bioactive compounds (tocols and carotenoids), fatty acids, polar components, triacylglycerols (TAG), and sterols (‘targeted methods’). Different chemometric tools are utilized for the efficacious evaluation of data resulting from the application of different analytical techniques. Among these, principal component analysis (PCA) is the most widely employed tool (Meenu et al., 2019).
The fatty acid (FA) profile is a typical characteristic of every vegetable oil and is usually used for the authentication of different vegetable oils in different food products by means of different techniques (high-performance liquid chromatography [HPLC], gas chromatography [GC], and mass spectroscopy [MS]). However, for identifying the botanical origin of oil in a blend of vegetable oils, the sole application of fatty acid profile is not sufficient (Osorio et al., 2014).
Triacylglycerols generally follow a typical pattern in different oils, because TAG stereo-specific distribution on glycerol molecule is controlled genetically (Andrikopoulos, 2002).
Analysis of minor constituents, such as tocols (Mignogna et al., 2015; Osorio et al., 2014) and sterols, is shown to aid authenticity of oils; however, it is a less useful approach in mixtures of refined oils due to their low content in vegetable oils. The analysis of sterols through GC is a commonly used technique for detecting seed levels and high variability of sterols (Osorio et al., 2014). Not only vegetable products, such as oils but also nuts and cereals are good sources of tocols (tocopherols and tocotrienols) (Fratianni et al., 2013; Mignogna et al., 2015; Niro et al., 2019). Tocols exhibit a qualitative/quantitative variability because of natural variations, agronomic techniques, environmental conditions, and technological processes (among which, in vegetable oils, are different refining techniques). Consequently, in the authentication/adulteration studies, the analysis of tocopherols, in particular, is often considered complementary to that of TAG and fatty acid. Several authors proposed the use of tocopherols as tracers to identify, differentiate, and evaluate the quality of vegetable oils and foods (Aparicio and Aparicio-Ruiz, 2000; Manzi et al., 1998; Meenu et al., 2019; Tavares et al., 2016). Tocopherol content is used in chemometric treatments as a descriptor variable to aid in the classification of non-refined oils (González et al., 2001). A previous work done by Mignogna et al. (2015) evaluated the use of tocol profile (tocopherols and tocotrienols) in different bakery products as an approach to verify the information on fats/oils declared on labels. However, although the tocol profile was able to discriminate different vegetable oils or vegetable oils from animal fats, it failed in distinguishing fats with a very similar tocol profile, such as LF and BF.
Starting from these results, we investigated the possibility of using the tocol profile together with that of fatty acids as a tool to investigate the fats/oils added to bakery products. By using a chemometric approach, such as PCA analysis, the methodology was first used on biscuits prepared on a laboratory scale with different fats/oils as ingredients. Subsequently, it was tested on some of the most common bakery products found in commerce.
Materials and Methods
Preparation of biscuits
Twelve different types of shortbread biscuits were produced with different oils/fats, the most common ones used in commercial bakery products. The different used oils were specific for the food industry and were purchased from Oleificio Zucchi S.p.A (Cremona, Italy). Eight different typologies of biscuits were produced with BF, LF, sunflower oil (SO), high oleic sunflower oil (HSO), corn oil (CO), OO, extra virgin olive oil (EVO), and PO. Four products were prepared with two different oil blends (50:50 v/v): sunflower oil/olive oil (SOO), palm oil/olive oil (POO), sunflower oil/palm oil (SPO), and high oleic sunflower oil/palm oil (HSPO). The ingredients consisted of refined doppio zero (00) soft wheat flour (210 g), ultra high temperature (UHT)-processed milk (60 g), chemical yeast (one teaspoon), and granulated sugar (70 g). Fats/oils were added as follows: 80 g of each fat/oil, with the exception of 100 g of BF, considering the water content, and 40 g of each oil in blends. Ingredients were mixed by adding water to obtain 440 g of dough (final weight). A planetary mixer with a K whisk was used (Kenwood Chef XL mod. KVL60; Kenwood, Havant, UK). After resting for 30 min, round-shaped biscuits were prepared by using a cookie drop machine. Biscuits were baked for 20 min in a ventilated rotating oven at 180°C (CIMAV, Villafranca, Italy) and cooled for 30 min at room temperature. Samples were crunched by using a laboratory mill (IKA A10; Staufen, Germany) and stored at –20°C until analysis. Three different biscuit preparations were created for every typology of fat/oil.
Sampling of commercial bakery products
In all, the most popular 33 commercial bakery products, with variability in their composition, were purchased from local markets of Italy. The used fats/oils, declared on the label, were taken into account according to their largest distribution. In particular, products were labelled as prepared with BF (four samples), LF (four samples), SO (two samples), HSO (six samples), CO (three samples), OO (two samples), EVO (five samples), and PO (five samples). Other two commercial biscuit samples, one labelled as prepared with PO, SO, and coconut oil (VO) and the other with PO and rapeseed oil (MO), were sampled. For their identification and composition, see the Supplementary Table S1. A laboratory mill (IKA A10; Staufen) was used to crunch samples. Samples were stored at –20°C until analysis.
Chemicals
Standards of α- β- γ-, and δ-tocopherol were bought from Merck (Darmstadt, Germany) while α-β-γ, and δ-tocotrienol standards were purified from a barley sample as described by Panfili et al. (2003). Fatty acid standards were from Sigma Aldrich (St. Louis, MO, USA). All other reagents were bought from Carlo Erba (Milano, Italy). Moisture was determined by measuring weight loss after heating the samples at 130°C (American Association of Cereal Chemists [AACC], 1995).
Tocol analysis
Tocols were determined by using a saponification procedure and extraction with solvents as reported by Panfili et al. (2003). Briefly, 0.5–1 g of sample was saponified in a tube with 2 mL of potassium hydroxide (600 g/L), 2 mL of sodium chloride (10 g/L), 2 mL of ethanol (95%), and 5 mL of ethanolic pyrogallol (60 g/L), followed by nitrogen flushing. The tubes were cooled after alkaline digestion at 70°C for 45 min. Sodium chloride (10 g/L) was added (15 mL) and a twice extraction with n-hexane/ethyl acetate (9:1 v/v; 15 mL) followed. The organic phase was evaporated and the dry residue was resuspended in a solution of isopropyl alcohol (1%) in n-hexane (2 mL). HPLC (Dionex, Sunnyvale, CA, USA) was used to analyze the extract by means of a 250 × 4.6-mm internal diameter, 5-µm particle size 100 A Luna Phenomenex Si column (Phenomenex, Torrance, CA, USA). An analytical system consisting of a U3000 pump and a 50-µL injector loop (Rheodyne, Idex Health & Science, Northbrook, IL, USA) was used. Detection of all peaks was performed fluorimetrically at an excitation wavelength of 290 nm and an emission wavelength of 330 nm by means of a RF-2000 spectrofluorimeter (Dionex, Sunnyvale, USA). N-hexane/ethyl acetate/acetic acid (97.3:1.8:0.9 v/v/v) was used as mobile phase at a flow rate of 1.6 mL/min (Panfili et al., 2003). Compounds were identified and quantified by comparison with available standard solutions. α-Tocomonoenol (α-T1) was quantified using the α-tocopherol standard solution. A Dionex Chromeleon chromatography system (Version 6.6; Dionex, Sunnyvale, CA, USA) was used for data processing.
Fatty acid analysis
Fats were extracted using the Soxhlet method (AACC, 1995). N-heptane, 2 mL, was added to about 2 g of sample and mixed for 30 s, followed by the addition of 0.2 mL of KOH in MeOH (2 M). In all, 1 μL of supernatant was injected into a Dany Master GC GC-FID (DANI Instruments S.p.A, Cologno Monzese, Milan, Italy). The GC was equipped with a flame ionization detector (FID, 280°C) fed with air (300 mL/min), helium (20 mL/min), and hydrogen (30 mL/min) and a 30 m × 0.25 mm × 0.25 μm TeknoKroma capillary column (model MetaX5; TeknoKroma, Sant Cugat del Vallés, Barcelona, Spain). A temperature vaporizer (PTV) was used programmed to start at 110°C (1 min) to 280°C (5 min) at 800°C/min. The programmed oven started at 100°C (1 min) and mounted to 280°C (5 min) at 10°C/min (Russo et al., 2016). The chromatograms were processed by the Clarity software (Solihull, UK). Fatty acids were identified through external standards and each fatty acid was expressed as a percent of the total fatty acids.
Statistical analysis
Three different biscuit preparations were created for every typology of fat/oil. For commercial samples, two different samples for the same product were purchased. The average on three analytical determinations of each preparation/commercial sample was calculated. Results were reported as the average of data coming from different fats/oils bakery typologies (both for laboratory-prepared and commercial samples). PCA (Husson et al., 2011) was performed using fatty acids and tocols as active variables. As a supplementary variable, the classification of fats/oils was used. The investigation was accomplished by means of the R Studio Software with the package FactoMineR (Lê et al., 2008). The factorability of the set of variables was checked using the Bartlett sphericity test.
Results and Discussion
Tocol and fatty acid composition of used ingredients and laboratory-prepared biscuits
The average tocol content in both used ingredients and prepared biscuits is shown in Table 1. Tocols are expressed as single compounds, total compounds, and tocotrienols–tocopherols (T3/T) ratio. Values are reported as mg/100 g of dry weight (d.w.).
Table 1. Average tocol content (mg/100 g d.w.) in used ingredients and prepared biscuits.
| Samples | α-T | β-T | γ-T | δ-T | α-T3 | β-T3 | γ-T3 | δ-T3 | α-T1 | T3/T | Total |
|---|---|---|---|---|---|---|---|---|---|---|---|
| Ingredients | |||||||||||
| BF | 0.6 (0.1) | n.d. | n.d. | n.d. | n.d. | n.d. | n.d. | n.d. | n.d. | n.d. | 0.6 (0.1) |
| LF | 0.3 (0.1) | n.d. | n.d. | n.d. | n.d. | n.d. | n.d. | n.d. | n.d. | n.d. | 0.3 (0.0) |
| SO | 62.2 (1.3) | 1.9 (0.5) | 0.6 (0.0) | n.d. | n.d. | n.d. | n.d. | n.d. | n.d. | n.d. | 64.8 (1.9) |
| HSO | 58.4 (0.9) | 2.8 (0.8) | 0.3 (0.0) | n.d. | n.d. | n.d. | n.d. | n.d. | n.d. | n.d. | 61.5 (1.3) |
| CO | 20.1 (0.0) | n.d. | 72.6 (2.2) | 2.1 (0.1) | n.d. | n.d. | 1.4 (0.2) | n.d. | n.d. | 0.01 (0.00) | 96.2 (2.1) |
| OO | 14.1 (0.1) | 0.6 (0.0) | 1.1 (0.0) | n.d. | n.d. | n.d. | n.d. | n.d. | n.d. | n.d. | 15.8 (0.1) |
| EVO | 16.9 (0.1) | 0.9 (0.1) | 1.4 (0.1) | n.d. | n.d. | n.d. | n.d. | n.d. | n.d. | n.d. | 19.3 (0.1) |
| PO | 11.2 (0.7) | 0.2 (0.0) | 0.9 (0.0) | n.d. | 12.6 (0.8) | n.d. | 12.6 (1.1) | 0.5 (0.0) | 2.2 (0.2) | 2.08 (0.02) | 40.2 (2.5) |
| SOO | 38.2 (0.6) | 1.2 (0.2) | 0.8 (0.0) | n.d. | n.d. | n.d. | n.d. | n.d. | n.d. | n.d. | 40.3 (0.9) |
| POO | 12.7 (0.4) | 0.4 (0.0) | 1.0 (0.0) | n.d. | 6.3 (0.4) | n.d. | 6.3 (0.5) | 0.2 (0.0) | 1.1 (0.1) | 0.91 (0.04) | 28.0 (1.3) |
| SPO | 36.7 (0.9) | 1.1 (0.2) | 0.8 (0.0) | n.d. | 6.3 (0.4) | n.d. | 6.3 (0.4) | 0.2 (0.0) | 1.1 (0.0) | 0.33 (0.02) | 52.5 (1.7) |
| HSPO | 34.8 (0.7) | 1.5 (0.2) | 0.6 (0.0) | n.d. | 6.3 (0.4) | n.d. | 6.3 (0.5) | 0.2 (0.0) | 1.1 (0.0) | 0.35 (0.01) | 50.9 (1.6) |
| Flour | 0.4 (0.0) | 0.2 (0.0) | n.d. | n.d. | 0.2 (0.0) | 1.6 (0.2) | tr | n.d. | n.d. | 3.00 (0.02) | 2.4 (0.1) |
| Milk | 0.1 (0.0) | n.d. | n.d. | n.d. | n.d. | n.d. | n.d. | n.d. | n.d. | n.d. | 0.1 (0.0) |
| Biscuits | |||||||||||
| BF | 0.3 (0.0) | 0.1 (0.0) | n.d. | n.d. | 0.1 (0.0) | 0.7 (0.0) | n.d. | n.d. | n.d. | 2.13 (0.06) | 1.2 (0.0) |
| LF | 0.1 (0.0) | 0.1 (0.0) | n.d. | n.d. | 0.1 (0.0) | 0.8 (0.1) | n.d. | n.d. | n.d. | 3.70 (0.18) | 1.0 (0.1) |
| SO | 12.8 (1.3) | 0.6 (0.0) | 0.2 (0.0) | n.d. | 0.1 (0.0) | 0.8 (0.1) | n.d. | n.d. | n.d. | 0.07 (0.00) | 14.4 (1.4) |
| HSO | 10.3 (0.7) | 0.5 (0.0) | 0.3 (0.0) | n.d. | 0.2 (0.0) | 0.8 (0.1) | n.d. | n.d. | n.d. | 0.08 (0.00) | 12.3 (0.8) |
| CO | 4.2 (0.2) | 0.1 (0.0) | 14.5 (0.2) | 0.4 (0.0) | 0.2 (0.0) | 0.9 (0.0) | 0.2 (0.0) | n.d. | n.d. | 0.07 (0.00) | 20.4 (0.1) |
| OO | 2.9 (0.1) | 0.1 (0.0) | 0.3 (0.0) | n.d. | 0.1 (0.0) | 0.7 (0.0) | n.d. | n.d. | n.d. | 0.25 (0.01) | 4.1 (0.1) |
| EVO | 5.9 (0.0) | 0.1 (0.0) | 0.4 (0.0) | n.d. | 0.1 (0.0) | 0.8 (0.0) | n.d. | n.d. | n.d. | 0.13 (0.01) | 7.3 (0.2) |
| PO | 2.3 (0.2) | 0.1 (0.0) | 0.3 (0.0) | n.d. | 2.2 (0.1) | 0.7 (0.0) | 2.5 (0.2) | 0.4 (0.0) | 0.3 (0.0) | 2.23 (0.02) | 8.8 (0.6) |
| SOO | 9.4 (1.6) | 0.3 (0.0) | 0.3 (0.0) | n.d. | 0.2 (0.0) | 0.8 (0.1) | n.d. | n.d. | n.d. | 0.10 (0.00) | 10.9 (1.7) |
| POO | 3.9 (0.1) | 0.2 (0.0) | 0.4 (0.1) | n.d. | 2.3 (0.1) | 0.9 (0.0) | 2.4 (0.1) | 0.1 (0.0) | 0.3 (0.0) | 1.27 (0.07) | 10.5 (0.7) |
| SPO | 7.5 (0.1) | 0.3 (0.0) | 0.3 (0.0) | n.d. | 1.7 (0.0) | 0.8 (0.1) | 1.8 (0.2) | 0.1 (0.0) | 0.5 (0.0) | 0.55 (0.04) | 13.0 (0.8) |
| HSPO | 5.5 (0.8) | 0.2 (0.0) | 0.2 (0.0) | n.d. | 1.4 (0.2) | 0.8 (0.0) | 2.2 (0.0) | 0.1 (0.0) | 0.3 (0.0) | 0.78 (0.08) | 10.7 (1.1) |
Standard deviations are reported in parentheses.
BF: butter; LF: lard; SO: sunflower oil; HSO: high oleic sunflower oil; CO: corn oil; OO: olive oil; EVO: extra-virgin olive oil; PO: palm oil; SOO: sunflower/olive oil; POO: palm/olive oil; SPO: sunflower/palm oil; HSPO: high oleic sunflower/palm oil; n.d.: not detected; tr: traces.
The highest tocol content was found in vegetable oils, while the lowest values were those of animal fats, where only α-T was discovered. The predominant tocol in SO and OO was α-T, with low contents of β-T and γ-T. In CO, the main tocol was γ-T, followed by α-T, δ-T, and γ-T3. PO was characterized by the presence of γ-T3, α-Τ3, α-Τ, γ-T, δ-T3, and β-T. In all palm products, another peak, identified as α-tocomonoenol (α-T1), was discovered, accounting for about 5% of total tocols. Several papers confirmed the results (Bonvehi et al., 2000; De Leonardis et al., 2016; Mignogna et al., 2015; Müller et al., 2018; Ng et al., 2004; Puah et al., 2007). Flour was characterized by low amounts of α-T, β-T, and α-T3, and higher levels of β-T3, which was the main tocol. In milk, only α-T was discovered at lesser amount than those found in fats/oils.
The tocol profile of the prepared biscuits reflected the profile of respective ingredients; apart from that of oils/fats, it also reflected that of cereals, where tocols are distributed differently (Fratianni et al., 2012, 2013; Mignogna et al., 2015). In particular, with the exception of the higher amounts of α-T3 in the biscuits prepared with PO and its blends, in all products, low levels of α-T3 from the flour were observed. Moreover, flour also provided the same amount of β-T3 in all prepared products.
Table 2 reports results of fatty acids in the used ingredients and prepared biscuits, expressed as percent.
Table 2. Average fatty acids (%) in the used ingredients and prepared biscuits.
| Samples | C10:0 | C12:0 | C14:0 | C16:0 | C16:1 | C18:0 | C18:1 | C18:2 | C20:0 | C18:3 | C20:1 | C22:0 |
|---|---|---|---|---|---|---|---|---|---|---|---|---|
| Ingredients | ||||||||||||
| BF | 3 (0) | 5 (0) | 17 (0) | 28 (0) | 2 (0) | 11 (0) | 26 (1) | 8 (0) | 0.3 (0.0) | 0.3 (0.0) | 1 (0) | 0.3 (0.0) |
| LF | n.d. | n.d. | 1 (0) | 27 (1) | 2 (0) | 13 (1) | 40 (1) | 16 (1) | 0.4 (0.1) | 0.2 (0.0) | n.d. | 0.1 (0.0) |
| SO | n.d. | 0.2 (0.0) | 0.4 (0.0) | 11 (0) | n.d. | 5 (0) | 23 (0) | 56 (0) | 1 (0) | 1 (0) | 1 (0) | 2 (0) |
| HSO | n.d. | 0.2 (0.0) | 0.4 (0.1) | 10 (0) | 1 (0) | 5 (0) | 65 (0) | 15 (0) | 1 (0) | 1 (0) | 1 (0) | 3 (1) |
| CO | n.d. | n.d. | 0.4 (0.1) | 14 (0) | n.d. | 9 (0) | 28 (1) | 45 (1) | 1 (0) | 1 (0) | 2 (0) | 0.3 (0.0) |
| OO | n.d. | n.d. | 0.2 (0.0) | 18 (0) | n.d. | 4 (0) | 60 (0) | 14 (0) | 1 (0) | 1 (0) | 1 (0) | 0.4 (0.0) |
| EVO | n.d. | n.d. | 0.2 (0.0) | 18 (0) | n.d. | 4 (0) | 61 (0) | 16 (0) | 1 (0) | 0.2 (0.0) | 0.4 (0.0) | 0.2 (0.0) |
| PO | n.d. | n.d. | 3 (0) | 38 (1) | n.d. | 6 (0) | 38 (0) | 11 (0) | 2 (0) | 2 (0) | 1 (0) | 0.2 (0.0) |
| SOO | n.d. | 0.1 (0.0) | 0.3 (0.0) | 14 (0) | n.d. | 6 (0) | 42 (0) | 35 (0) | 1 (0) | 1 (0) | 1 (0) | 1 (0) |
| POO | n.d. | n.d. | 2 (0) | 28 (1) | n.d. | 5 (0) | 49 (0) | 12 (0) | 1 (0) | 2 (0) | 1 (0) | 0.4 (0.0) |
| SPO | n.d. | 0.1 (0.0) | 2 (0) | 25 (0) | n.d. | 6 (0) | 30 (0) | 33 (1) | 1 (0) | 1 (0) | 1 (0) | 1 (0) |
| HSPO | n.d. | 0.1 (0.0) | 2 (0) | 24 (0) | 0.4 (0.0) | 5 (0) | 51 (1) | 13 (0) | 1 (0) | 1 (0) | 1 (0) | 2 (0) |
| Flour | n.d. | n.d. | n.d. | 18 (1) | tr | tr | 16 (1) | 61 (1) | tr | 4 (0) | n.d. | n.d. |
| Milk | 7 (0) | 4 (0) | 11 (0) | 28 (1) | 3(0) | 12(1) | 29 (1) | 3 (0) | n.d. | 1 (0) | n.d. | n.d. |
| Biscuits | ||||||||||||
| BF | 3 (0) | 5 (0) | 15 (1) | 31 (3) | 2 (0) | 10 (1) | 25 (0) | 8 (0) | 0.2 (0.0) | 0.3 (0.0) | 0.3 (0.1) | 0.1 (0.0) |
| LF | n.d. | n.d. | 1 (0) | 28 (1) | 2 (0) | 12 (1) | 40 (1) | 17 (1) | 0.2 (0.1) | n.d. | n.d. | 1 (0) |
| SO | n.d. | 0.3 (0.0) | 1 (0) | 12 (0) | 1 (0) | 4 (0) | 24 (1) | 54 (1) | 1 (0) | 0.3 (0.1) | 1 (0) | 3 (0) |
| HSO | n.d. | 0.2 (0.1) | 0.4 (0.1) | 8 (0) | 1 (0) | 4 (0) | 65 (1) | 14 (1) | 1 (0) | 2 (0) | 1 (0) | 3 (0) |
| CO | n.d. | n.d. | 1 (0) | 10 (0) | 1 (0) | 7 (0) | 31 (2) | 49 (2) | 1 (0) | 1 (0) | 1 (0) | 0.3 (0.1) |
| OO | n.d. | n.d. | 1 (0) | 18 (2) | 1 (0) | 5 (0) | 60 (3) | 12 (1) | 1 (0) | 1 (0) | 1 (0) | 0.4 (0.1) |
| EVO | n.d. | n.d. | 0.1 (0.0) | 19 (0) | 1 (0) | 4 (1) | 60 (2) | 15 (0) | 1 (0) | 1 (0) | 1 (0) | 0.2 (0.1) |
| PO | n.d. | n.d. | 2 (0) | 41 (2) | 0.1 (0.0) | 6 (1) | 36 (1) | 12 (1) | 1 (0) | 1 (0) | 1 (0) | 0.2 (0.0) |
| SOO | n.d. | 0.1 (0.0) | 0.3 (0.0) | 13 (0) | 0.4 (0.1) | 3 (1) | 48 (2) | 30 (2) | 1 (0) | 1 (0) | 1 (0) | 1 (0) |
| POO | n.d. | n.d. | 1 (0) | 30 (1) | 0.2 (0.0) | 7 (0) | 48 (3) | 12 (1) | 1 (0) | 1 (0) | 1 (0) | 0.2 (0.1) |
| SPO | n.d. | tr | 2 (0) | 31 (1) | 0.1 (0.0) | 4 (0) | 28 (0) | 31 (1) | 1 (0) | 1 (0) | 1 (0) | 1 (0) |
| HSPO | n.d. | tr | 2 (0) | 32 (1) | 0.2 (0.0) | 6 (0) | 46 (1) | 11 (1) | 1 (0) | 0.3 (0.1) | 1 (0) | 2 (0) |
Standard deviations are reported in parentheses.
BF: butter; LF: lard; SO: sunflower oil; HSO: high oleic sunflower oil; CO: corn oil; OO: olive oil; EVO: extra-virgin olive oil; PO: palm oil; SOO: sunflower/olive oil; POO: palm/olive oil; SPO: sunflower/palm oil; HSPO: high oleic sunflower/palm oil; n.d.: not detected; tr: traces.
Palmitic acid (C16:0) and oleic acid (C18:1) were the predominant fatty acid in animal fats (BF and LF). Contrary to LF products, myristic (C14:0), capric (C10:0), and lauric acid (C12:0) were also found in butter and butter-made products. Vegetable oils and their products were characterized by the presence of linoleic acid (C18:2), oleic acid, and palmitic acid, which were the main fatty acids in corn and sunflower samples. In all sunflower oil samples, lauric acid was found at low proportions. In HSO, OO, and EVO, as well as the respective prepared biscuits, the main fatty acids were oleic, linoleic, palmitic acids. In PO and the respective products, palmitic acid and oleic acid were the most representative constituents. In all samples, with the exception of BF products, capric acid and lauric acid were scarcely or not present and long-chain fatty acids (C20:0, C20:1, and C22:0) were not detected or detected at low amounts. The results were in accordance with those reported in literature for the same oils/fats (Devi and Khatkar, 2018; Dubois et al., 2007; Tsimidou et al., 1987). Either for tocols or fatty acids, the 50:50 blends and the respective products reflected the composition of starting ingredients.
PCA analysis of laboratory-prepared biscuits
PCA was applied for the categorization of samples in order to validate the suitability of tocols and fattyacids in classifying laboratory-prepared biscuits. PCA was used to: derive principal components from data, examine the grouping of samples, and visualize the relative distribution of products according to the presence of their fat/oil. For the interpretation of results, the following measures were considered: (a) squared cosines, which measured the quality of the representation on the PCA map of both variables and individuals, (b) coordinates of individuals on the factor map, (c) linear c orrelations of variables with axis (dimensions), and (d) contribution in percentage, computed from squared cosines. All these measures are shown in Supplementary Tables S2–S4.
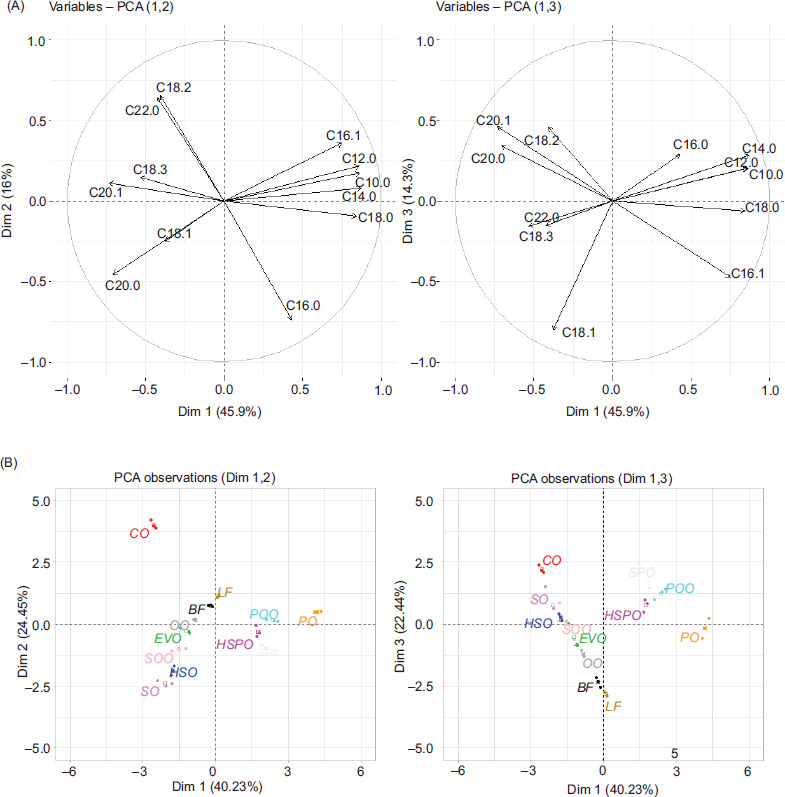
Figure 1A shows the loading plot of the first three principal components (PC1, PC2, and PC3) for the classification of laboratory-prepared biscuits, considering fatty acids from different fat/oil ingredients.
Figure 1. (A) Loading plot of the first three principal components; (B) score plot of principal component analysis (PC1 vs. PC2 and PC1 vs. PC3) with fatty acids as variables in laboratory-prepared biscuits. For fat/oil identification, see Tables 1 and 2.
The first two PCs explained about 62% of variation related to different fatty acids, with PC1 having 46% variability and PC2 having 16% variability. The third component (PC3) accounted for 15% variability (Figure 1A). C10:0, C12:0, C14:0, and C18:0 fatty acids were well depicted on PC1. The squared cosines ranged from 0.71 (for C18:0) to 0.76 (for C14:0) (Table S2). These fatty acids were highly and positively correlated with the first dimension (PC1), giving maximum contribution (in percentage) to PC1 (values higher than 0.8). C16:1 also had a positive correlation with PC1 (0.75) and was quite represented on this axis. On the contrary, C20:0 and C20:1, with squared cosines of 0.50 and 0.54, were moderately well represented, showing a negative correlation with the PC1 (-0.71 and -0.73). Only C16:0, C18:2, and C22:0 fatty acids had a correlation of about 0.4. While C16:0 was negatively correlated with PC2, the other two showed a positive correlation with this axis. As shown in Figure 1B, the only samples having positive coordinates on PC1 were those prepared with LF and BF. The three BF samples mainly contributed for PC1 (on average 22%). Moreover, having squared cosines between 0.89 and 0.96, the goodness of fit was very high. The SOO samples were also well depicted in PC1 (with squared cosines ranging from 0.61 to 0.77). Considering the percentage values, SO, PO, POO, and HSO were the samples that highly contributed to PC2. Samples that presented the highest squared cosines were POO (between 0.79 and 0.82).
The overall results showed that if PC1 allowed observing a distance of BF and LF from other fats/oils, in PC2, the contrast between SO, HSO, and SOO and samples containing PO would be evidenced.
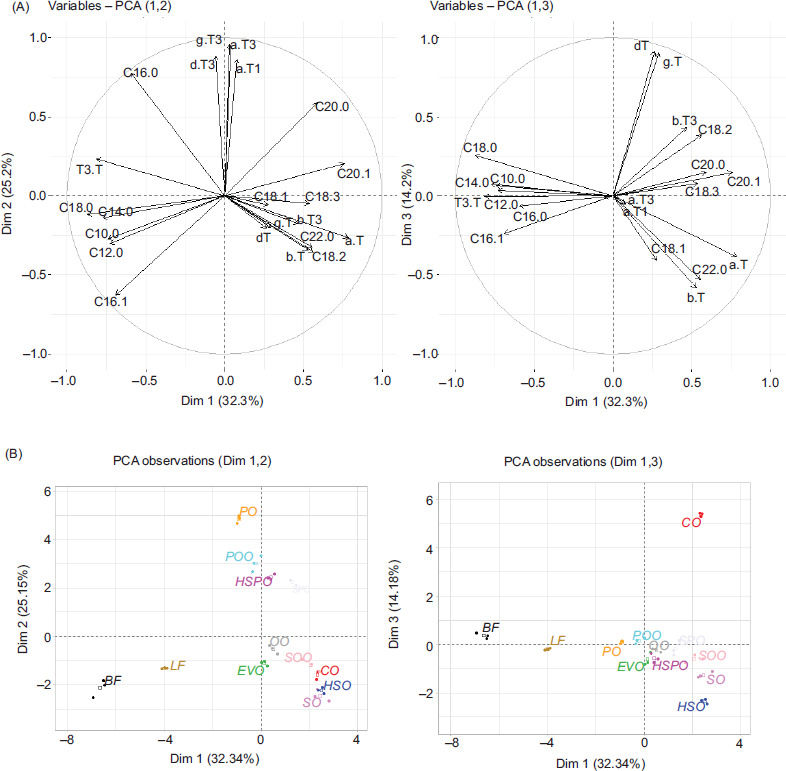
Figures 2A and 2B show the PCA performed using tocols as variables (α-, β-, γ-, and δ-tocopherol, α-tocomonoenol, and α-, β-, γ-, and δ-tocotrienol, the T3/T ratio).
Figure 2. (A) Loading plot of the first three principal components; (B) score plot of principal component analysis (PC1 vs. PC2 and PC1 vs. PC3) with tocols as variables in the laboratory-prepared biscuits. For fat/oil identification, see Tables 1 and 2.
The 65% of variability was explained by the first two PCA dimensions (40% and 24 %, respectively). The third dimension was also quite significant, having 22% of variability (Figure 2A).
αT3, α-T1, γ-T3 , and δ-T3, with squared cosines from 0.67 (α-T1) to 0.81 (α-T3) were well depicted on PC1, showing the highest percentage values (Table S3). They showed a positive correlation with PC1, higher than 0.8. The other tocols showed a negative correlation with PC1 (Figure 2A). Regarding PC2, α-T, β-T, γ-T , and δ-T were quite well represented (squared cosines ≥0.5). α-T and β-T showed a negative correlation with PC2, while a positive correlation was found for γ-T and δ-T. The contribution of these variables in percentage to PC2 was very high, from 20% for α-T to 27% for β-T. Samples prepared with PO were adequately or quite adequately depicted by PC1 and situated in the right part of individual map (Figure 2B). The second dimension (PC2) was mainly explained by CO samples and SO-prepared products (SO, SOO, and SPO). CO samples were located at the top-left of the map, while sunflower products without PO were found in the third quadrant. Overall, while PC1 evidenced the separation of palm-based products from others, PC2 placed CO samples against SOO and SO products.
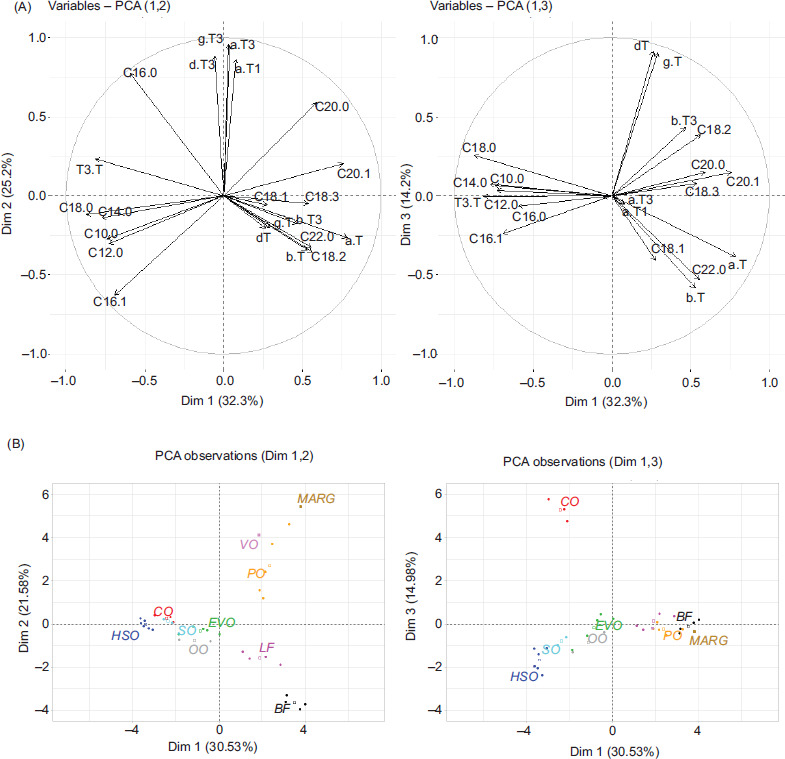
In order to investigate whether the combination of tocols and fatty acid profiles could give a better separation of the investigated samples, PCA was performed with these variables taken together. Results are shown in Figures 3A and 3B.
Figure 3. (A) Loading plot of the first three principal components; (B) score of principal component analysis (PC1 vs. PC2 and PC1 vs. PC3) with fatty acids and tocols as variables in the laboratory-prepared biscuits. For fat/oil identification, see Tables 1 and 2.
About 71% of the variation was explained by the first three PCs; in particular, PC1 accounted for 32%, PC2 for 25%, and PC3 for 14% (Figure 3A). In PC1, some fatty acids (C10:0, C12:0, C14:0, C16:1, C18:0, and C20:1) were quite well depicted, having squared cosines higher than 0.4 and were negatively correlated with PC1 (Table S4). α-T3, α-T1, γ-T3, and δ-T3 and C16:0 had a significant positive correlation with PC2. In Figure 3B, PC1 helps to enlighten LF and BF products situated in the third quadrant, and SOO samples placed in the fourth quadrant. Products with PO were well separated and situated at the top of the individual map (showing positive coordinates). While PC1 was mainly driven by BF and LF samples against biscuits prepared with other fats/oils, PC2 separated products prepared with PO from others. CO samples were well separated from others prepared with SO and OO in the PC3 map of individuals because of the levels of δ-T, which was present only in CO biscuits, levels of γ-T, which were extremely higher in CO biscuits than in others, and those of C18:2 Indeed, these variables were also most relevant in composing the third component (PC3).
Tocols and fatty acids were also used as variables to classify used fat/oil ingredients (data not shown). The 78% of overall variance was explained by the first three principal components of PCA (36% for PC1, 27% for PC2, and 13% for PC3). The individual factor of PCA map confirmed distinction between PO-based products (in the first and fourth quadrant), LF and BF (in the second quadrant), and other products (in the third quadrant). PO and POO products were well represented by PC1, while BF reported high values of squared cosines for PC2.
The overall results showed that a better identification of added fats/oils in prepared biscuits could be obtained by the combined use of fatty acid and tocol profiles. These variables, analyzed together, allowed a better distinction of poorly classified samples of Figure 1B, such as PO, POO, SPO, and HOSPO, and improved the separation of LF and BF samples of Figure 2B.
PCA analysis of commercial bakery products
The obtained results with laboratory-prepared biscuits were validated with commercial bakery samples. All 33 commercial samples were analyzed for tocol and fatty acid profiles (Tables S5 and S6, respectively). As already mentioned, in the analyzed bakery products, tocol and fatty acid profiles reflected not only those coming from the added oil/fat but also the ones present in other used ingredients, such as eggs, milk, and different cereals.
PCA was used for the categorization of samples, using fat/oil classification as a supplementary qualitative variable. For the interpretation of results, the same measures used for the laboratory-prepared biscuits were considered (data not shown). The obtained results confirmed what was found in laboratory-prepared biscuits. Figure 4 shows the multivariate analysis performed using tocols (eight vitamers, α-tocomonoenol, and T3/T ratio) and fatty acids.
Figure 4. (A) Loading plot of the first three principal components; (B) score plot of principal component analysis (PC1 vs. PC2 and PC1 vs. PC3) (B) with fatty acids and tocols as variables in commercial bakery products. BF: butter; LF: lard; SO: sunflower oil; HSO: high oleic sunflower oil; CO: corn oil; OO: olive oil; EVO: extra-virgin olive oil; PO: palm oil; VO: vegetable oil; MARG: margarine.
The first two dimensions of PCA explained the 52% of overall variability. By adding the third dimension, the proportion increased to 67%. The highest contribution for the first dimension came from C16:0 (11%), followed by T3/T ratio (10.6%) and C18:1 (8%), while for the second dimension, the variables affording maximum contributions were α-T3, γ-T3, δ-T3, and α-T1. The third dimension was mainly driven by γ-T, δ-T, and C18:2. For what concerns the goodness of fit, C:16 and C:18.1 acids were represented in the first principal component along with tocols α-T1, β-T1, and T3/T.
α-T1, α-T3, γ-T3, and δ-T3 were well represented in the second principal component PC2 and were positively correlated with this dimension (Figure 4A). BF and LF samples (in the fourth quadrant) and SO-based products (second and third quadrants) were well represented by PC1. The second principal component PC2 separated palm-based biscuits from those made with other oils. Following the PCA computed for laboratory-prepared biscuits, PC3 helped to enlighten a separation of products prepared with CO from those prepared with other vegetable oils as well as products prepared with OO from products prepared with SO (Figure 4B), even because of the levels of δ-T and γ-T, which characterized the biscuits labelled as CO.
Conclusions
Results from this study demonstrate that the combined use of tocol and fatty acids profiles through a chemometric approach, such as the PCA analysis, could be used for the identification of the origin of oils/fats added as ingredients in bakery products. The tested methodology was also effective for complex samples, such as commercial products, in which several ingredients (e.g., eggs, milk, and flours), with different fats, tocols, and fatty acids, could make interpretation of results difficult. The set-up approach helping in the verification of information given on food labels could represent a further tool for quality control that could be tested in different food matrices. Future studies must be addressed considering the effects of different formulations, processing conditions, and the use of different statistical techniques.
Conflict of Interest
Authors report no conflicts of interest.
Author Contributions
Conceptualization, A.F. and G.P.; methodology, A.F., I.N., R.I; validation, A.F., G.P. , P.A. and R.I; formal analysis, A.D., I.N and S.N.; investigation, A.D., I.N and S.N.; data curation, A.F., I.N. and R.I.; validation, A.F., G.P., I.N. and R.I.; writing—original draft preparation, A.F., I.N. and R.I.; writing—review and editing, A.F., G.P., P.A and R.I.; visualization, A.D., A.F., G.P., I.N., P.A., R.I. and S.N.; supervision G.P. and R.I.
REFERENCES
American Association of Cereal Chemists (AACC). 1995. AACC method 30-20. In: Approved Methods of the AACC, 9th Edition. AACC, St. Paul, MN.
Andrikopoulos N.K. 2002. Chromatographic and spectroscopic methods in the analysis of triacylglycerol species and regiospecific isomers of oils and fats. Crit Rev Food Sci Nutr. 42: 473–505. 10.1080/20024091054229
Aparicio R., and Aparicio-Ruiz R. 2000. Authentication of vegetable oils by chromatographic techniques. J Chromatogr A. 881: 93–104. 10.1016/s0021-9673(00)00355-1
Bonvehi J.S., Coll F.V., and Rius I.A. 2000. Liquid chromatographic determination of tocopherols and tocotrienols in vegetable oils, formulated preparations, and biscuits. J AOAC Int. 83: 627–634. 10.1093/jaoac/83.3.627
Cerretani L., Lerma-García M.J., Herrero-Martínez J.M., Gallina-Toschi T., and Simo-Alfonso E.F. 2010. Determination of tocopherols and tocotrienols in vegetable oils by nano-liquid chromatography with ultraviolet visible detection using a silica monolithic column. J Agric Food Chem. 58: 757–761. 10.1021/jf9031537
Chen H., Huang J., Su Y., Fu M., and Kan J. 2024. Effects of oil and heating on the physicochemical and microstructural properties of gluten-starch dough. Food Chem. 436: 137571. 10.1016/j.foodchem.2023.137571
Costa A.M.M., Silva L.O., and Torres A.G. 2019. Chemical composition of commercial cold-pressed pomegranate (Punica granatum) seed oil from Turkey and Israel, and the use of bioactive compounds for samples’ origin preliminary discrimination. J Food Compos Anal. 75: 8–16. 10.1016/j.jfca.2018.09.004.
De Leonardis A., Macciola V., Niro S., Nag A., and Panfili G. 2016. Limits and potentials of African red palm oils purchased from European ethnic food stores. Eur Food Res. Technol. 243(7): 1239–1248. 10.1007/s00217-016-2839-1
Devi A., and Khatkar B.S. 2018. Effects of fatty acids composition and microstructure properties of fats and oils on textural properties of dough and cookie quality. J Food Sci Technol. 5: 321–330. 10.1007/s13197-017-2942-8
Dubois V., Breton S., Linder M., Fanni J., and Parmentier M. 2007. Fatty acid profiles of 80 vegetable oils with regard to their nutritional potential. Eur J Lipid Sci Technol. 109: 710–732. 10.1002/ejlt.200700040
European Union. 2011. Regulation (EU) No. 1169/2011 of the European Parliament and the Council of 25 October 2011 on the provision of food information to consumers. Off J EU. L 304/18.
Fratianni A., Di Criscio T., Mignogna R., and Panfili G. 2012. Carotenoids, tocols and retinols evolution during egg pasta-making processes. Food Chem. 131(2): 590–595. 10.1016/j.foodchem.2011.09.034
Fratianni A., Giuzio L., Di Criscio T., Flagella Z., and Panfili G. 2013. Response of carotenoids and tocols of durum wheat in relation to water stress and sulfur fertilization. J Agric Food Chem. 61: 2583–2590. 10.1021/jf304168r
Gambelli L., and Logman M., 2015. Why palm oil intake is of no health concern. Agro Food Ind Hi Tech. 26(6): 24–28.
Ghotra B.S., Dyal S.D., and Narine S.S. 2002. Lipid shortenings: a review. Food Res Int. 35: 1015–1048. 10.1016/S0963-9969(02)00163-1
González A.G., Pablos F., Martín M.J. León-Camacho M., and Valdenebro M.S. 2001. HPLC analysis of tocopherols and triglycerides in coffee and their use as authentication parameters. Food Chem. 73: 93–101. 10.1016/S0308-8146(00)00282-X
Greenpeace. 2018. Greenpeace slams APP/Sinar Mas over links to deforestation, ends all engagement with company. Available at: https://www.greenpeace.org/international/press-release/16535/greenpeace-slams-app-sinar-mas-over-links-to-deforestation-ends-allengagement-with-company/. Accessed May 17, 2018.
Hrncirik K., and van Duijn G. 2011. An initial study on the formation of 3-MCPD esters during oil refining. Eur J Lipid Sci Technol. 113: 374–379. 10.1002/ejlt.201000317
Husson F., Lê S., and Pagès J. 2011.Exploratory Multivariate Analysis by Example Using R, vol. 15. CRC Press, Boca Raton.
Lê S., Josse J., and Husson F. 2008. Facto Mine R: an R package for multivariate analysis. J Stat Softw. 25(1): 1–18. 10.18637/jss.v025.i01
Manzi P., Panfili G., Esti M., and Pizzoferrato L. 1998. Natural antioxidants in the unsaponificable fraction of virgin olive oils from different cultivars. J Sci Food Agric. 77: 115–120. 10.1002/(SICI)1097-0010(199805)77:1<115::AID-JSFA13>3.0.CO;2-N
Meenu M., Cai Q., and Xu B. 2019. A critical review on analytical techniques to detect adulteration of extra virgin olive oil. Trends Food Sci Tech. 91: 391–408. https://www.x-mol.com/paperRedirect/5789012
Mignogna R., Fratianni A., Niro S., and Panfili G. 2015. Tocopherol and tocotrienol analysis as a tool to discriminate different fat ingredients in bakery products. Food Control. 54: 31–38. 10.1016/j.foodcont.2015.01.032
Müller M., Hammann S., and Vetter W. 2018. Counter current chromatographic isolation and purification of 11′-α-tocomonoenol from the vitamin E extract of palm oil. Food Chem. 256: 327–332. 10.1016/j.foodchem.2018.02.133
Ng M.H., Choo Y.M., Ma A.N., Chuah C.H., and Ali H.M. 2004. Separation of vitamin E (tocopherol, tocotrienol and tocomonoenol) in palm oil. Lipids. 39: 1031–1035. 10.1007/s11745-004-1327-y
Niro S., D’Agostino A., Fratianni A., Cinquanta L., and Panfili G. 2019. Gluten-free alternative grains: nutritional evaluation and bioactive compounds. Foods. 8: 208. 10.3390/foods8060208
Osorio M.T., Haughey S.A., Elliott C.T., and Koidis A. 2014. Evaluation of methodologies to determine vegetable oil species present in oil mixtures: proposition of an approach to meet the EU legislation demands for correct vegetable oils labelling. Food Res Int. 60: 66–75. 10.1016/j.foodres.2013.12.013
Panfili G., Fratianni A., and Irano M. 2003. Normal phase high-performance liquid chromatography method for the determination of tocopherols and tocotrienols in cereals. J Agric Food Chem. 51: 3940–3944. 10.1021/jf030009v
Puah C.W., Choo Y.M., Ma A.N., and Chuah C.H. 2007. The effect of physical refining on palm vitamin E (tocopherol, tocotrienol and tocomonoenol). Am J Appl Sci. 4: 374–377. 10.3844/ajassp.2007.374.377
Ray C.L., Gawenis J.A., and Greenlief C.M. 2022. A new method for olive oil screening using multivariate analysis of proton NMR spectra. Molecules. 27: 213. 10.3390/molecules27010213
Rohman A., Ghazali M.A.B., Windarsih A., Irnawati Riyanto S., Yusof F.M., and Mustafa, S. 2020. Comprehensive review on application of FTIR spectroscopy coupled with chemometrics for authentication analysis of fats and oils in the food products. Molecules. 25: 5485. 10.3390/molecules25225485
Russo M.V., Avino P., and Notardonato I. 2016. Fast analysis of phthalates in freeze-dried baby foods by ultrasound-vortex-assisted liquid-liquid microextraction coupled with gas chromatography-ion trap/mass spectrometry. J Chromatogr A. 1474: 1–7. 10.1016/j.chroma.2016.10.058
Tavares K.M., Lima A.R., Nunes C.A., Silva V.A., Mendes E., Casal S., and Pereira R.G.F.A. 2016. Free tocopherols as chemical markers for Arabica coffee adulteration with maize and coffee by-products. Food Control. 70: 318–324. 10.1016/foodcont.2016.06.011
Tsimidou M., Macrae R., and Wilson I. 1987. Authentication of virgin olive oils using principal component analysis of triglyceride and fatty acid profiles: part 2–detection of adulteration with other vegetable oils. Food Chem. 25(4): 251–258. 10.1016/0308-8146(87)90011-2
Wong R.S.Y., and Radhakrishnan A.K. 2012. Tocotrienol research: past into present. Nutr Rev. 70: 483–490. 10.1111/j.1753-4887.2012.00512.x
Supplementary
Table S1. Investigated commercial bakery products and their ingredients.
| Code | Product | Ingredients |
|---|---|---|
| 1 | Biscuit | Wheat flour, butter, milk, and malt extract |
| 2 | Biscuit | Wheat flour, butter, malt extract, and milk powder |
| 3 | Biscuit | Wheat flour, butter, eggs, and milk |
| 4 | Biscuit | Whole meal flour, wheat flour, butter, eggs, milk powder, and malt extract |
| 5 | Biscuit | Wheat flour, lard, and milk, eggs |
| 6 | Sandwich loaf | Wheat flour, lard, barley malt flour, and milk powder |
| 7 | Sandwich loaf | Wheat flour, lard, and malt extract |
| 8 | Sandwich loaf | Wheat flour, lard, and malt extract |
| 9 | Biscuit | Wheat flour, sunflower oil, barley flakes, extruded cereal food (barley fiber, rice flour, oat flour, and powdered malt extract), and barley flour |
| 10 | Biscuit | Wheat flour, sunflower oil, whole milk, and eggs |
| 11 | Biscuit | Whole-wheat flour, high oleic sunflower oil, milk, eggs, and malt extract. |
| 12 | Biscuit | Whole wheat flour, cereals (wheat flour, barley flour, rice flour, rye flour, and oat flour), high oleic sunflower oil, and milk |
| 13 | Biscuit | Whole wheat, high oleic sunflower oil, eggs, and milk |
| 14 | Croissant | Wheat flour, high oleic sunflower oil, and eggs |
| 15 | Biscuit | Oat flakes, wheat flour, high oleic sunflower oil, and cereals (corn, barley, rice, and malt extract), whole wheat flour, and malt extract |
| 16 | Biscuit | Oat flakes, whole wheat flour, cereal mix (corn, oat, rice, and malt extract), high oleic sunflower oil, and malt extract |
| 17 | Biscuit | Wheat flour, corn oil, wheat bran, eggs, and barley malt flour |
| 18 | Biscuit | Wheat flour, corn oil, whole milk, and eggs |
| 19 | Biscuit | Whole wheat flour, wheat bran, corn oil, eggs, and whole milk |
| 20 | Sandwich loaf | Wheat flour, olive oil, and barley malt flour |
| 21 | Sandwich loaf | Semolina, olive oil, and barley malt flour |
| 22 | Biscuit | Wheat flour, extra virgin olive oil, and eggs |
| 23 | Biscuit | Wheat flour, extra virgin olive oil, and cocoa powder |
| 24 | Biscuit | Spelta flour, spelta flakes, and extra virgin olive oil |
| 25 | Biscuit | Wheat flour and extra virgin olive oil |
| 26 | Sandwich loaf | Wheat flour, extra virgin olive oil, and barley malt flour |
| 27 | Biscuit | Wheat flour, palm oil, eggs, and milk |
| 28 | Biscuit | Wheat flour, palm oil, and skimmed milk powder |
| 29 | Biscuit | Barley, wheat flour, palm oil, barley malt, and skimmed milk powder |
| 30 | Biscuit | Wheat flour, palm oil, milk, whole milk powder, and malt extract |
| 31 | Biscuit | Wheat flour, palm oil, eggs, milk, and malt extract |
| 32 | Croissant | Wheat flour, vegetable oils (palm oil, sunflower oil, and coconut oil), eggs, and skimmed milk powder |
| 33 | Croissant | Wheat flour, margarine (palm oil and rapeseed oil), and eggs |
In bold, the oils/fats ingredients are reported.
Table S2. Output of the PCA variables (first three dimensions) with fatty acids in the laboratory-prepared biscuits.
| Fatty acids | PC1 | PC2 | PC3 | ||||||
|---|---|---|---|---|---|---|---|---|---|
| Cos2 | Corr | Contrib. | Cos2 | Corr | Contrib. | Cos2 | Corr | Contrib. | |
| C10.0 | 0.748 | 0.865 | 13.571 | 0.030 | 0.174 | 1.582 | 0.042 | 0.204 | 2.431 |
| C12.0 | 0.739 | 0.860 | 13.412 | 0.047 | 0.217 | 2.449 | 0.042 | 0.205 | 2.446 |
| C14.0 | 0.760 | 0.872 | 13.79 | 0.006 | 0.079 | 0.324 | 0.082 | 0.285 | 4.760 |
| C16.0 | 0.184 | 0.430 | 3.349 | 0.547 | –0.740 | 28.548 | 0.084 | 0.289 | 4.892 |
| C16.1 | 0.560 | 0.749 | 10.173 | 0.129 | 0.359 | 6.723 | 0.223 | –0.473 | 13.051 |
| C18.0 | 0.709 | 0.842 | 12.878 | 0.009 | –0.096 | 0.477 | 0.004 | –0.062 | 0.226 |
| C18.1 | 0.142 | –0.377 | 2.579 | 0.063 | –0.251 | 3.299 | 0.645 | –0.803 | 37.681 |
| C18.2 | 0.166 | –0.407 | 3.010 | 0.429 | 0.655 | 22.393 | 0.211 | 0.459 | 12.32 |
| C20.0 | 0.502 | –0.709 | 9.114 | 0.211 | –0.460 | 11.027 | 0.119 | 0.345 | 6.933 |
| C18.3 | 0.284 | –0.533 | 5.159 | 0.022 | 0.147 | 1.126 | 0.025 | –0.157 | 1.439 |
| C20.1 | 0.536 | –0.732 | 9.731 | 0.012 | 0.111 | 0.640 | 0.214 | 0.462 | 12.479 |
| C22.0 | 0.178 | –0.422 | 3.232 | 0.410 | 0.641 | 21.411 | 0.023 | –0.152 | 1.343 |
Cos2: squared cosines; Corr: correlation with axes; Contrib: contributions in percent; PC1: principal component 1; PC2: principal component 2; PC3: principal component 3.
Table S3. Output of PCA variables (first three dimensions) with tocols in laboratory-prepared biscuits.
| Tocols | PC1 | PC2 | PC3 | ||||||
|---|---|---|---|---|---|---|---|---|---|
| Cos2 | Corr | Contrib. | Cos2 | Corr | Contrib. | Cos2 | Corr | Contrib. | |
| α-T | 0.171 | –0.413 | 4.244 | 0.478 | –0.692 | 19.565 | 0.304 | 0.551 | 13.541 |
| β-T | 0.130 | –0.361 | 3.243 | 0.654 | –0.808 | 26.728 | 0.079 | 0.282 | 3.538 |
| γ-T | 0.151 | –0.389 | 3.765 | 0.577 | 0.759 | 23.578 | 0.216 | 0.465 | 9.620 |
| δ-T | 0.148 | –0.385 | 3.675 | 0.595 | 0.771 | 24.315 | 0.200 | 0.447 | 8.898 |
| α-T1 | 0.669 | 0.818 | 16.632 | 0.010 | –0.099 | 0.404 | 0.199 | 0.446 | 8.848 |
| α-T3 | 0.807 | 0.898 | 20.059 | 0.001 | –0.024 | 0.024 | 0.17 | 0.412 | 7.571 |
| β-T3 | 0.139 | –0.373 | 3.459 | 0.042 | 0.205 | 1.714 | 0.479 | 0.692 | 21.343 |
| γ-T3 | 0.804 | 0.897 | 19.992 | 0.000 | 0.009 | 0.004 | 0.17 | 0.412 | 7.567 |
| δ-T3 | 0.751 | 0.867 | 18.673 | 0.002 | 0.042 | 0.072 | 0.031 | 0.176 | 1.375 |
| T3/T | 0.252 | 0.502 | 6.259 | 0.088 | 0.297 | 3.598 | 0.397 | –0.63 | 17.700 |
Cos2: squared cosines; Corr: correlation with axes; Contrib: contributions in percent; PC1: principal component 1; PC2: principal component 2; PC3: principal component 3.
Table S4. Output of PCA variables (first three dimensions) with tocols and fatty acids in the laboratory-prepared biscuits.
| Tocols/Fatty acids | PC1 | PC2 | PC3 | ||||||
|---|---|---|---|---|---|---|---|---|---|
| Cos2 | Corr | Contrib. | Cos2 | Corr | Contrib. | Cos2 | Corr | Contrib. | |
| α-T | 0.614 | 0.784 | 8.638 | 0.069 | –0.263 | 1.247 | 0.148 | –0.385 | 4.744 |
| β-T | 0.279 | 0.528 | 3.915 | 0.118 | –0.344 | 2.135 | 0.340 | –0.583 | 10.895 |
| γ-T | 0.085 | 0.291 | 1.194 | 0.039 | –0.198 | 0.711 | 0.822 | 0.907 | 26.367 |
| δ-T | 0.070 | 0.264 | 0.980 | 0.041 | –0.203 | 0.741 | 0.836 | 0.914 | 26.791 |
| α-T1 | 0.006 | 0.079 | 0.087 | 0.748 | 0.865 | 13.519 | 0.003 | –0.051 | 0.082 |
| α-T3 | 0.001 | 0.037 | 0.020 | 0.904 | 0.951 | 16.334 | 0.000 | –0.016 | 0.008 |
| β-T3 | 0.217 | 0.466 | 3.057 | 0.031 | –0.177 | 0.568 | 0.188 | 0.433 | 6.025 |
| γ-T3 | 0.001 | 0.030 | 0.013 | 0.918 | 0.958 | 16.596 | 0.000 | 0.008 | 0.002 |
| δ-T3 | 0.003 | –0.057 | 0.046 | 0.782 | 0.885 | 14.138 | 0.000 | –0.008 | 0.002 |
| T3/T ratio | 0.661 | –0.813 | 9.289 | 0.055 | 0.234 | 0.990 | 0.000 | –0.002 | 0.000 |
| C10:0 | 0.552 | –0.743 | 7.764 | 0.076 | –0.275 | 1.366 | 0.004 | 0.064 | 0.131 |
| C12:0 | 0.530 | –0.728 | 7.445 | 0.093 | –0.305 | 1.681 | 0.001 | 0.037 | 0.043 |
| C14:0 | 0.598 | –0.773 | 8.399 | 0.020 | –0.140 | 0.354 | 0.005 | 0.073 | 0.170 |
| C16:0 | 0.353 | –0.594 | 4.955 | 0.604 | 0.777 | 10.916 | 0.004 | –0.065 | 0.138 |
| C16:1 | 0.475 | –0.689 | 6.680 | 0.393 | –0.627 | 7.094 | 0.057 | –0.239 | 1.835 |
| C18:0 | 0.758 | –0.871 | 10.662 | 0.014 | –0.118 | 0.251 | 0.066 | 0.258 | 2.129 |
| C18:1 | 0.077 | 0.277 | 1.081 | 0.003 | –0.055 | 0.055 | 0.167 | –0.408 | 5.350 |
| C18:2 | 0.316 | 0.562 | 4.441 | 0.128 | –0.357 | 2.305 | 0.148 | 0.385 | 4.750 |
| C20:0 | 0.349 | 0.591 | 4.912 | 0.350 | 0.592 | 6.325 | 0.022 | 0.149 | 0.709 |
| C18:3 | 0.290 | 0.538 | 4.075 | 0.002 | –0.048 | 0.041 | 0.006 | 0.079 | 0.199 |
| C20:1 | 0.573 | 0.757 | 8.049 | 0.041 | 0.202 | 0.737 | 0.022 | 0.149 | 0.710 |
| C22:0 | 0.306 | 0.553 | 4.298 | 0.105 | –0.324 | 1.895 | 0.278 | –0.527 | 8.919 |
Cos2: squared cosines; Corr: correlation with axes; Contrib: contributions in percent; PC1: principal component 1; PC2: principal component 2; PC3: principal component 3.
Table S5. Average content of tocols (mg/kg d.w.) in commercial bakery products.
| Samples | αT | βT | γT | δT | αT1 | αT3 | βT3 | γT3 | δT3 | Total tocols | T3/T ratio |
|---|---|---|---|---|---|---|---|---|---|---|---|
| BF (#4) | 6.4 (3.0) | 1.7 (0.7) | 0.3 (0.4) | n.d. | n.d. | 1.2 (0.6) | 13.8 (2.8) | n.d. | n.d. | 23.5 (4.3) | 1.9 |
| LF (#4) | 3.4 (1.2) | 1.6 (0.2) | 0.2 (0.3) | n.d. | n.d. | 0.9 (0.4) | 12.7 (3.0) | n.d | n.d. | 18.8 (2.6) | 2.8 |
| SO (#2) | 76.3 (16.4) | 5.0 (0.8) | 4.0 (1.9) | n.d. | n.d. | 5.0 (4.1) | 10.5 (2.1) | 0.8 (0.5) | n.d. | 101.5 (17.6) | 0.2 |
| HSO (#6) | 103.1 (22.2) | 6.9 (0.6) | 5.1 (4.1) | n.d. | n.d. | 1.9 (0.9) | 11.2 (4.0) | n.d | n.d. | 128.1 (24.7) | 0.1 |
| CO (#3) | 46.6 (19.3) | 4.9 (0.9) | 112.3 (21.1) | 3.1 (0.4) | n.d. | 4.7 (1.3) | 14.3 (2.9) | 0.6 (0.3) | n.d. | 186.6 (39.6) | 0.1 |
| OO (#2) | 5.0 (1.6) | 1.8 (0.7) | 1.6 (0.7) | n.d. | n.d. | 0.4 (0.1) | 10.5 (3.1) | n.d | n.d. | 18.8 (6.2) | 1.3 |
| EVO (#5) | 31.0 (15.0) | 2.5 (1.1) | 1.5 (0.8) | n.d. | n.d. | 1.3 (0.8) | 11.1 (3.4) | n.d | n.d. | 48.5 (16.1) | 0.4 |
| PO (#5) | 23.3 (11.9) | 2.0 (0.5) | 2.6 (1.4) | n.d. | 3.0 (1.3) | 178.3 (60.7) | 87.4 (14.1) | 213.4 (47.4) | 39.7 (6.3) | 97.2 (43.6) | 2.8 |
| VO (#1) | n.d. | 3.4 (0.4) | 3.7 (0.5) | n.d. | 5.5 (0.4) | 27.8 (8.5) | 11.7 (1.8) | 39.0 (3.7) | 7.8 (0.5) | 147.4 (36.9) | 1.4 |
| MO (#1) | 23.5 (4.3) | 1.4 (0.2) | 6.3 (0.3) | n.d. | 6.1 (0.3) | 44.1(10.3) | 13.2 (2.6) | 58.9 (2.3) | 10.0 (0.8) | 179.6 (28.3) | 2.4 |
Standard deviations are reported in parentheses.
BF: butter; LF: lard; SO: sunflower oil; HSO: high oleic sunflower oil; CO: corn oil; OO: olive oil; EVO: extra-virgin olive oil; PO: palm oil; VO: vegetable oil; MO: margarine; n.d.: not detected.
Table S6. Average content of fatty acids (%) in commercial bakery products.
| Samples | C10:0 | C12:0 | C14:0 | C16:0 | C16:1 | C18:0 | C18:1 | C18:2 | C20:0 | C18:3 | C20:1 | C22:0 | SFA | MUFA | PUFA |
|---|---|---|---|---|---|---|---|---|---|---|---|---|---|---|---|
| BF (#4) | 3 (0) | 5 (0) | 15 (2) | 32 (2) | 2 (0) | 12 (1) | 24 (1) | 6 (0) | 0.2 (0.1) | 1 (0) | 0.4 (0.2) | 0.2 (0.1) | 67 (2) | 26 (1) | 7 (0) |
| LF (#4) | n.d. | 0.1 (0.0) | 1 (0) | 28 (1) | 3 (1) | 15 (4) | 36 (3) | 16 (4) | 0.4 (0.2) | 0.3 (0.2) | 0.3 (0.2) | 0.1 (0.1) | 45 (3) | 39 (3) | 16 (5) |
| SO (#2) | n.d | 0.1 (0.0) | 0.3 (0.2) | 11 (5) | – | 3 (1) | 70 (7) | 13 (1) | 0.3 (0.0) | 0.1 (0.0) | 1 (0) | 1 (0) | 16 (8) | 70 (7) | 13 (1) |
| HSO (#6) | n.d | 0.1 (0.0) | 0.1 (0.0) | 12 (2) | 0.2 (0.1) | 5 (1) | 64 (6) | 15 (6) | 2 (1) | 1 (0) | 1 (0) | 1 (0) | 20 (4) | 65 (5) | 16 (6) |
| CO (#3) | n.d | n.d. | 0.2 (0.1) | 11 (1) | 0.1 (0.1) | 3 (1) | 32 (1) | 52 (1) | 0.4 (0.1) | 0.3 (0.2) | 0.4 (0.2) | 0.3 (0.2) | 15 (2) | 32 (1) | 52 (1) |
| OO (#2) | n.d | 0.1 (0.1) | 0.1 (0.0) | 11 (6) | 1 (0) | 7 (1) | 64 (6) | 14 (2) | 1 (0) | 1 (0) | 1 (0) | 1 (0) | 20 (6) | 66 (6) | 15 (3) |
| EVO (#5) | n.d | n.d | n.d. | 20 (6) | 0.4 (0.3) | 5 (1) | 59 (11) | 16 (5) | 0.4 (0.0) | 1 (0) | 0.2 (0.1) | n.d. | 26 (7) | 60 (11) | 17 (4) |
| PO (#5) | n.d | 0.3 (0.1) | 1 (0) | 42 (1) | 0.2 (0.1) | 5 (1) | 37 (2) | 12 (2) | 1 (0) | 0.4 (0.2) | 0.4 (0.2) | 0.1 (0.0) | 50 (2) | 38 (2) | 12 (2) |
| VO (#1) | n.d | 0.2 (0.0) | 1 (0) | 36 (5) | 0.2 (0.1) | 5 (1) | 37 (2) | 20 (7) | 0.4 (0.1) | 1 (0) | 0.2 (0.1) | 0.2 (0.1) | 43 (5) | 38 (3) | 21 (3) |
| MO (#1) | n.d | 0.3 (0.1) | 2 (0) | 43 (4) | 0.1 (0.0) | 7 (1) | 36 (2) | 12 (1) | 1 (0) | 0.3 (0.0) | 0.1 (0.0) | n.d. | 53 (4) | 36 (3) | 12 (1) |
Standard deviations are reported in parentheses.
BF: butter; LF: lard; SO: sunflower oil; HSO: high oleic sunflower oil; CO: corn oil; OO: olive oil; EVO: extra-virgin olive oil; PO: palm oil; VO: vegetable oil; MO: margarine; SFA: saturated fatty acids; MUFA: mono-unsaturated fatty acids; PUFA: poly-unsaturated fatty acids; n.d.: not detected.