
Download
p = m C p Δ T Δ t 1 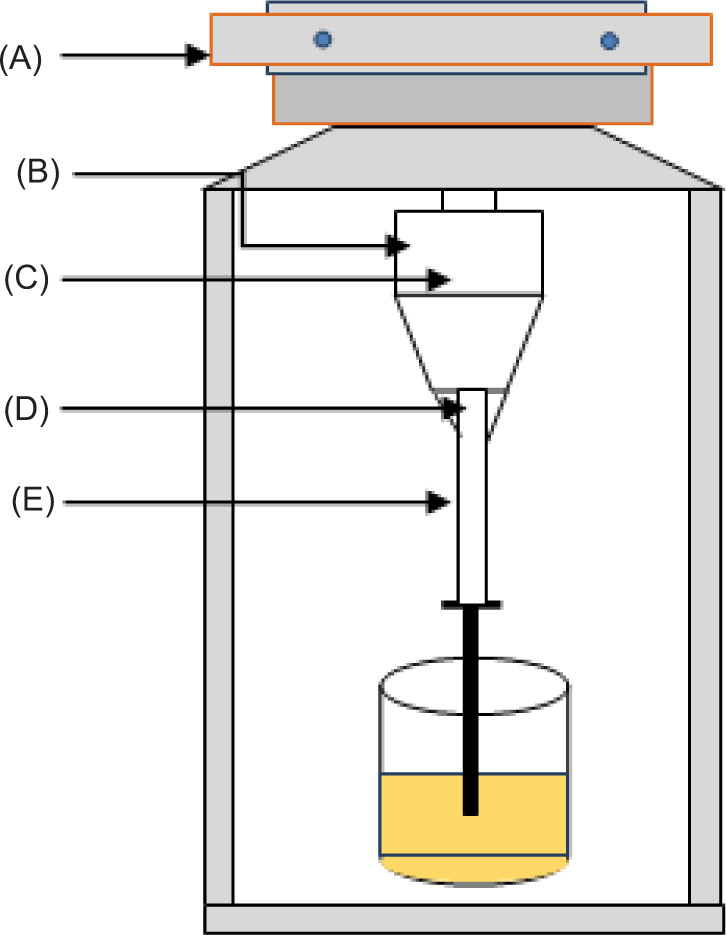
ORIGINAL ARTICLE
Enhancement of processed cheese quality using ultrasound: energy density optimization and industrial applications
Khalid A. Alsaleem*
Department of Food Science and Human Nutrition, College of Agriculture and Food, Qassim University, Buraydah 51452, Saudi Arabia
Abstract
This study examined the impact of varying ultrasound energy densities on the functional properties of processed cheese with different levels of emulsifying salt (0%, 0.5%, 1%, 2%, or 3% disodium phosphate). The mixtures were ultrasonicated at 65 watts and 160 watts for either 3 min or 9 min, producing energy densities of 58.5 J/g, 175.5 J/g, 144 J/g, and 432 J/g. The rheological and textural properties of the processed cheese were evaluated at these energy densities and compared to a control sample. At 432 J/g, cheese with 1% emulsifying salt was cooked whereas cheese at 58.5 J/g, 175.5 J/g, and 144 J/g did not cook with the emulsifying salt levels of 1% or lower. There was no significant difference (p > 0.05) in hardness and melting temperature between cheese having the energy density of 432 J/g and processed with 1% and 2% emulsifying salt. Additionally, no significant difference (p > 0.05) was observed in the functional properties of cheese across different energy density treatments. The functional properties of the processed cheese improved significantly with increased emulsifying salt levels. This study suggests that using 432 J/g of ultrasound energy can effectively reduce the requirement of emulsifying salts in the cheese industry.
Key words: emulsifying salts, energy density, functional properties, processed cheese, rheological functions, sensory evaluation, ultrasound
Corresponding Author: Khalid A. Alsaleem, Department of Food Science and Human Nutrition, College of Agriculture and Food, Qassim University, Buraydah 51452, Saudi Arabia. Email: [email protected]
Received: 16 June 2024; Accepted: 4 October 2024; Published: 14 October 2024
© 2024 Codon Publications
This is an Open Access article distributed under the terms of the Creative Commons Attribution-NonCommercial-ShareAlike 4.0 International (CC BY-NC-SA 4.0). License (http://creativecommons.org/licenses/by-nc-sa/4.0/)
Introduction
Practical applications: Ultrasound technology offers practical applications across dairy products such as milk, yogurt, and cheese, enhancing their characteristics and functionality. It facilitates the fractionation of dairy components, improving product yield and functionality. By reducing fat globule size and modifying micellar casein, ultrasound can potentially decrease reliance on emulsifying salts (ES) in dairy processing. These advancements underscore ultrasound’s versatility and potential in optimizing dairy production processes.
Processed cheese (PC) is a dairy product that is not made directly from milk but is manufactured by blending dairy and non-dairy ingredients at specific temperatures and speeds to produce a homogenized product with an extended shelf life (Alsaleem, 2022). The dairy ingredients include natural cheese, whey, micellar casein concentrate (MCC), micellar casein isolate (MCI), butter, anhydrous milk fat, while non-dairy ingredients comprise salt, water, ES, oil, flavors, and colors. There are various types of processed cheese, such as pasteurized processed cheese, pasteurized processed cheese food, pasteurized processed cheese spread, and pasteurized processed cheese sauces (Kapoor and Metzger, 2008). These types of cheese differ based on their moisture, fat, and natural cheese contents.
Emulsifying salts are crucial in the production of processed cheese, being ionic compounds with monovalent cations and polyvalent anions (Caric et al., 1985). ES serves multiple roles, including removing calcium ions from the protein network in natural cheese by disrupting the calcium–phosphate network and adjusting the potential of Hydrogen (pH) of the final product (Kapoor and Metzger, 2008). These adjustments enhance the homogenization of the final product by hydrating caseins and increasing interaction between water and fat phases. Common examples of ES used in processed cheese manufacturing include mono-, di-, and trisodium phosphates, dipotassium phosphate, sodium hexametaphosphate, sodium acid pyrophosphate, tetrasodium pyrophosphate, sodium aluminum phosphate, sodium citrate, potassium citrate, calcium citrate, sodium tartrate, and sodium-potassium tartrate. In the United States, trisodium citrate and disodium phosphate are the most popular ES.
Ultrasound (US) technology is employed to reduce casein particle size, denature whey protein at high densities (Hammam et al., 2021b), reduce fat globule size, and enhance the elasticity and density of gels (Madadlou et al., 2010). The ultrasound process involves periodic high- and low-pressure cycles by transmitting intensity and frequency sound waves through the liquid. At low pressure, vacuum bubbles form and collapse at high pressure, causing an increase in temperature and a collision between protein particles (Alsaleem et al., 2021). Researchers have found that applying ultrasound to milk at >20 kHz decreases casein micelle size (Shanmugam et al., 2012). When applied to milk for 15 min without temperature control, ultrasound increased the firmness (final G') of acid gels. Conversely, other studies showed that rennet-coagulated time and hardness of rennet-coagulated goat milk increased with ultrasound time of up to 7 min but diminished after 10 min (Zhao et al., 2014).
Increasing ultrasound energy density (USED) enhances the stability of foods through acoustic cavitation, generating low frequency, forming micro-bubbles, and causing their immediate collapse, which results in a high shear rate in product (Monteiro et al., 2018). USED has several advantages over other technologies, such as conventional heat treatment, pasteurization, and ultra-high temperature processes, because it is a non-thermal, environment-friendly treatment. USED has been applied to various dairy products, including fermented milk (Wu et al., 2000), milk (Bermúdez-Aguirre et al., 2009), cheese (Benedito et al., 2002), chocolate cake, chocolate mousse, chocolate genoise (Pingret et al., 2011), butter (Bermúdez-Aguirre and Barbosa-Cánovas, 2008), and yogurt. Applying ultrasound milk prior to preparation of cheese has technological advantages, such as increasing cheese yield efficiency (Terefe et al., 2016). Ultrasound is utilized to fractionate dairy components to improve product functionality or yield.
This study hypothesized that ultrasound could disrupt the calcium–phosphate network in natural cheese and decrease the size of fat globules, thereby reducing the need for ES. Consequently, this study investigated the effect of USED on the capacity of ES and the functional properties of the processed cheese. By applying various levels of USED to process cheese with different ES concentrations, the research aimed to optimize the functional properties of processed cheese while minimizing reliance on ES.
Materials and Methods
Experimental design
The mixture prepared using a KitchenAid mixer was divided into five 200-g portions (treatments). The first portion served as a control, while the second (T1), third (T2), fourth (T3), and fifth (T4) portions were subjected to ultrasound treatment at energy densities of 58.5, 175.5, 144, and 432 J/g, respectively (Table 1). Ultrasound treatment was applied at different durations (3 and 9 min) and amplitudes (50% and 100%) to achieve desired energy densities. Each treatment was tested with five levels of ES (0%, 0.5%, 1%, 2%, and 3% disodium phosphate). The experiment was repeated thrice to ensure consistency and reliability of results.
Table 1. Calculation of ultrasound energy density (USED) in ultrasonicated processed cheese.
| Treatment | Time (s) t | Sample wt (g) m | Power (W) P | Energy density (J/g)* | Temperature, ΔT (°C) |
|---|---|---|---|---|---|
| Control | – | – | – | – | – |
| US50-3 | 180 | 200 | 65 | 58.5 | 31.0 |
| US50-9 | 540 | 200 | 65 | 175.5 | 41.7 |
| US100-3 | 180 | 200 | 160 | 144 | 52.2 |
| US100-9 | 540 | 200 | 160 | 432 | 68.9 |
Values are means of triplicate measurements (n = 3).
*Energy density (ED) = Ptm–1.
(°C) is the sample’s increase of temperature during the processing period.
Processed cheese formulation
A processed cheese formulation was prepared using the TechWizard software, targeting a composition of 44% water, 25% fat, and 17% proteins. The ingredients used are listed in Table 2. The ingredients included cheddar cheese (Great Value, Mild Cheddar Cheese, Bentonville, AR), water, salted butter (L and O Lakes Half Stick Salted Butter INC., Arden Hills, MN), deproteinized whey (Bondgrads’ Creameries, Perham, MN), and dibasic sodium phosphate (Fisher Scientific, Fair Lawn, NJ). Cheddar cheese, butter, water, and milk permeate were mixed using a KitchenAid mixer at room temperature for 30 min to produce a homogeneous paste.
Table 2. Composition of processed cheese formulations treated with ultrasound using four different energy densities and five different levels of emulsifying salts.
| Ingredients | Treatments | ||||
|---|---|---|---|---|---|
| Control | T1 | T2 | T3 | T4 | |
| – | 58.5 J/g | 175.5 J/g | 144 J/g | 432 J/g | |
| Cheddar cheese | 66.95 | 66.95 | 66.95 | 66.95 | 66.95 |
| Butter | 3.45 | 3.45 | 3.45 | 3.45 | 3.45 |
| Deproteinized whey | 7.48 | 7.48 | 7.48 | 7.48 | 7.48 |
| Salt | 2.00 | 2.00 | 2.00 | 2.00 | 2.00 |
| Water | 18.11 | 18.11 | 18.11 | 18.11 | 18.11 |
| Disodium phosphate (%) | 0, 0.5, 1, 2, or 3 | 0, 0.5, 1, 2, or 3 | 0, 0.5, 1, 2, or 3 | 0, 0.5, 1, 2, or 3 | 0, 0.5, 1, 2, or 3 |
Ultrasound process
The ultrasound process was applied using the methodology reported by Liu et al. (2014), with some modifications. A Hielscher ultrasonic processor (UIP1000hd, Hielscher Ultrasonics GmbH, Teltow, Germany) was utilized to ultrasonicate a 200 g of mixed cheese (24°C) at 65 W (50% amplitude) and 160 W (100% amplitude) for 3 or 9 min. The ultrasonic processor’s probe was immersed into mixed cheese at the center and to a depth of about 2 to 3 cm (Figure 1). The initial and final temperatures were recorded to calculate increase in time elapsed during the experiment (Table 1). The acoustic power input was calculated using Equation (1):
where is p the power input in watts (W), Cp is the heat specific capacity of water (4.18 J/g °C), m is the mass of water (g), and ΔT/Δt is the increase of temperature of the ΔT/Δt sample during the processing time (Ragab et al., 2020). The acoustic energy density (ED) was calculated using Equation (2):
ED = Ptm–1 (2)
where ED is the acoustic energy density (J/g), p is the power input (W), t is the processing time (s), and m is the mass of sample (g).
Figure 1. Schematic diagram of ultrasonic measurement system: (A) generator, (B) transducer, (C) booster/amplifier, (D) sonotrode/horn, and (E) cheese.
Rapid visco analyzer (RVA)
A total of 25 g of mixed cheese and ES (0, 0.5, 1, 2, and 3% disodium phosphate) was transferred to a canister and tempered at 40°C for 15–20 min in a water bath. The canister was then placed into RVA (Perten RVA 4500, Macquarie Park NSW 2113, Australia). The mixture was cooked at 95°C for 3 min at a speed of 1,000 rpm, followed by 1 min at 160 rpm. The apparent viscosity of the processed cheese was measured at 90°C at the end of the cooking period by calculating mean of the last five viscosity values. The pH was adjusted to 5.6–5.7. The processed cheese was then poured into copper cylinders (20-mm diameter × 30-mm height) and plastic molds (28.3-mm diameter × 25-mm height), sealed with aluminum foil, and refrigerated until further analysis.
Dynamic stress rheometer (DSR) analysis
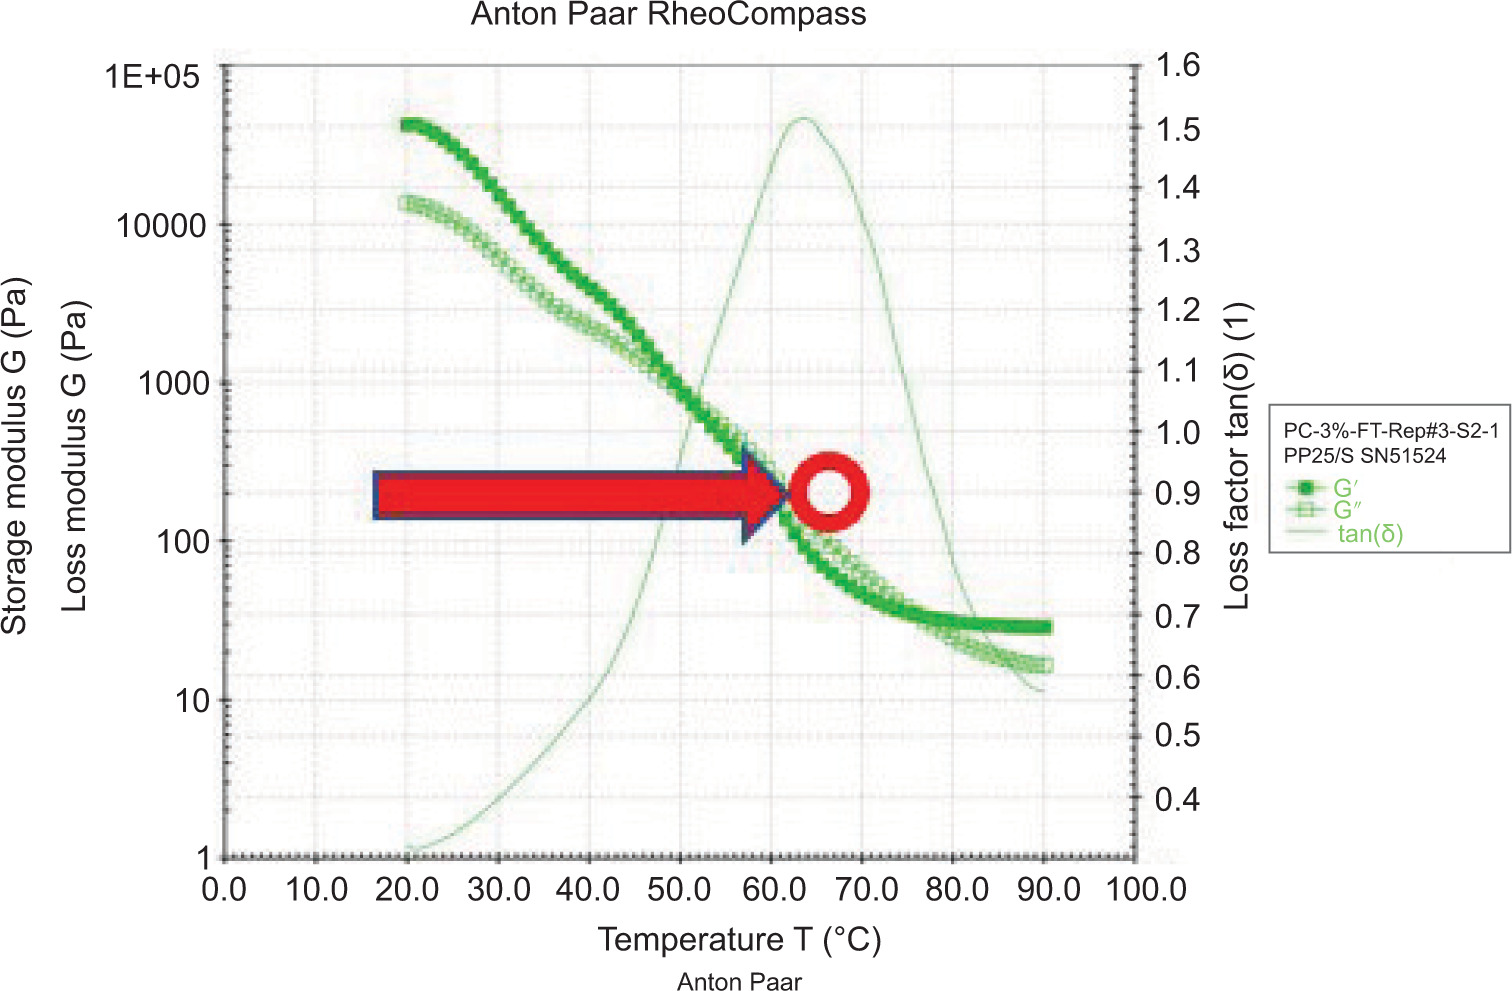
Dynamic rheological analysis was performed using a rheometer (MSR 92, Anton Paar, Graz, Austria) to assess the meltability of both processed cheese and ultrasound-treated processed cheese using 25-mm parallel plate geometry. The analysis followed the modified method of Alsaleem et al. (2024). A stress sweep test for processed cheese was conducted at a frequency of 1.5 Hz with a stress range of 1–1,000 Pa at 20°C, using a rheometer with parallel plate geometry. The test determined that the maximum stress limit for the linear viscoelastic region was 500 Pa. At room temperature, cheese was cut into 2-mm thick slices using a wire cutter. The melting temperature of the processed cheese was determined at a heating rate of 1°C/min, ranging from 20°C to 90°C, using a frequency of 1.5 Hz and a stable stress of 500 Pa (linear viscoelastic region). The elastic modulus (G'), viscous modulus (G″), tangent angle (tan δ), and melting temperature were identified. The temperature at which tan δ = 1 (G″/G') was defined as the cheese melting temperature, as shown in Figure 2. Dynamic rheological analysis was conducted in triplicate.
Figure 2. Measuring the melting point of the processed cheese using dynamic rheological analysis.
Scheiber melting test
Processed cheese samples were cut into cylinders with a diameter of 22.8 mm and height of 7 mm. These cylinders were placed on 1-mm aluminum plates measuring 10 cm × 8.5 cm. The dishes were then transferred to a forced draft oven at 90°C for 7 min by following the method described by Hammam et al. (2021a). After cooling of the dishes, the diameter of the melted processed cheese in millimeters was measured at four different locations using a vernier caliper. The areas of the initial diameter prior to melting and the diameter after melting were calculated. The difference between these areas represented the meltability of the processed cheese. This test was repeated for four times for each batch to ensure consistency and accuracy of results.
Texture profile analysis (TPA)
Hardness of the processed cheese was assessed using TPA. Portions of the processed cheese measuring 20 mm in height and 20 mm in diameter were cut using a wire cutter and prepared for TPA, which was conducted using uniaxial double bite compression with a 50-mm diameter cylindrical flat probe. The compression was set at 10% strain with a crosshead speed of 1 mm/s. The hardness of the processed cheese was defined as the peak force observed during initial compression. TPA measurements were performed on two samples from each replicate to ensure reliability and consistency of results.
Proximate composition
pH of the final processed cheese was measured using digital pH meter (Hanna Instruments Inc., Woonsocket, RI, USA). The moisture content of the processed cheese was determined in triplicate by heating a weighed sample of processed cheese (3 g) in an oven at 103°C for 24 h. Weight loss during heating was measured and considered as water content loss from processed cheese.
Statistical analysis
Statistical analysis was performed to examine the impact of ultrasound treatments on the functional properties of processed cheese at various levels of ES. The analysis utilized the ANOVA test performed with the R software. Mean separation was determined using the least significant difference (LSD) test, with statistical significance set at p < 0.05.
Results and Discussion
Proximate composition
Table 3 presents mean chemical properties, including pH and total solids (TS) of both processed cheese and processed cheese treated with ultrasound, calculated from three replicates. Statistical analysis revealed no significant difference (p > 0.05) in pH between the control processed cheese and ultrasound-treated processed cheese, except in case of processed cheese treated with ultrasound at T4 with 1% ES, where a slight and not statistically significant difference was observed, probably because of the low ES content used in manufacturing of processed cheese. ES are known to adjust pH, with higher levels increasing the pH of processed cheese. For instance, disodium phosphate at 1% solution typically ranges from 8.9 to 9.1 in pH, while in this study, the pH of processed cheese ranged from 5.5 to 5.64, consistent with typical pH values of processed cheese (Caric et al., 1985; Kapoor and Metzger, 2008).
Similarly, no significant difference (p > 0.05) was observed in total solids (TS) between control processed cheese and ultrasound-treated processed cheese that ranged from 56.05% to 57.4%. This ensured a fair comparison of composition between treatments, minimizing any potential effects on the functional properties of processed cheese related to its composition.
Table 3. pH and total solids (%) (n = 3) of both processed cheese and processed cheese treated with ultrasound at different levels of ES.
| Composition | Treatments* | ||||||||||
|---|---|---|---|---|---|---|---|---|---|---|---|
| Control | T1 | T2 | T3 | T4 | |||||||
| 2% | 3% | 2% | 3% | 2% | 3% | 2% | 3% | 1% | 2% | 3% | |
| pH | 5.54c,d,e | 5.57b,c,d | 5.55c,d,e | 5.59b,c,d | 5.6b,c,d | 5.57b,c,d,e | 5.6b,c,d | 5.64a,b | 5.5e | 5.54d,e | 5.56c,d,e |
| Total solids (%) | 56.92a,b | 56.39a,b | 56.06b | 56.85a,b | 56.05b | 56.1a,b | 56.70a,b | 57.4a | 56.18a,b | 56.16a,b | 56.25a,b |
*Treatments consisted of the following: control, which used processed cheese made with disodium phosphate; T1, processed cheese treated with ultrasound at 58.5 J/g; T2, processed cheese treated with ultrasound at 175.5 J/g; T3, processed cheese treated with ultrasound at 144 J/g; and T4, processed cheese treated with ultrasound at 432 J/g.
a,b,c,d,eMeans in the same column not sharing a common superscript are different at (P < 0.05).
Impact of emulsifying salts and ultrasonic
The presence of ES significantly affected the properties of processed cheese. PC containing 3% ES exhibited higher pH, viscosity, hardness, and melting temperature compared to the processed cheese formulations with lower ES concentrations. Processed cheese formulations containing 0%, 0.5%, and 1% ES did not undergo sufficient cooking, as these levels were insufficient to adequately remove calcium from the casein structure and induce casein degradation. However, processed cheese treated with ultrasound at 432 J/g achieved a cooked state even with 1% ES concentration. Ultrasound treatment induced changes in processed cheese properties by reducing protein particle size through extended ultrasonication (Jambrak et al., 2014; Nguyen and Anema, 2010; Zhao et al., 2014), resulting in a more uniform and homogeneous particle distribution.
Functional Properties
Cooked apparent viscosity
The viscosity of processed cheese is crucial as it indicates the spreadability of processed cheese after complete melting. The mean cooked viscosity values (cP) of both processed cheese and processed cheese treated with ultrasound, and determined using RVA, are presented in Table 4. Processed cheese formulated with 2% ES showed viscosity values of 1002 cP for control, and 1183.67, 1104, 1158.33, and 1206.6 cP for T1, T2, and T3 treatments, respectively. However, no significant difference (p > 0.05) was observed among these treatments.
Table 4. Viscosity and hardness (g) (n = 3) of both processed cheese and processed cheese treated with ultrasound at different concentrations of ES.
| Composition | Treatments* | ||||||||||
|---|---|---|---|---|---|---|---|---|---|---|---|
| Control | T1 | T2 | T3 | T4 | |||||||
| 2% | 3% | 2% | 3% | 2% | 3% | 2% | 3% | 1% | 2% | 3% | |
| Viscosity (cP) | 1002c | 1667.3a | 1183.67c | 1734.33a | 1104c | 1694.3a | 1158.33c | 1732.67a | 900c | 1206.6b,c | 1560.6a,b |
| Hardness (g) | 49.97b,c,d | 64.3a,b | 48.93c,d | 57.83a,b,c | 54.63b,c,d | 58.70a,b,c | 46.23c,d | 70.48a | 31.0e | 40.55d,e | 56.25a,bc |
*Treatments consisted of the following: control, which used processed cheese made with disodium phosphate; T1, processed cheese treated with ultrasound at 58.5 J/g; T2, processed cheese treated with ultrasound at 175.5 J/g; T3, processed cheese treated with ultrasound at 144 J/g; and T4, processed cheese treated with ultrasound at 432 J/g.
a,b,c,d,eMeans in the same column not sharing a common superscript are different at (P < 0.05).
For processed cheese formulated with 3% ES, viscosity values were 1667.3 cP for control, and 1734.33, 1694.3, 1732.67, and 1560.6 cP for T1, T2, and T3 treatments, respectively. Ultrasound treatment did not significantly affect (p > 0.05) the viscosity of processed cheese across treatments. However, a significant difference (p < 0.05) in viscosity was observed between processed cheese formulated with 2% and 3% ES, with processed cheese containing 3% ES demonstrating higher viscosity.
Slight variations in pH could influence the viscosity of processed cheese (Caric et al., 1985). ES and pH play vital roles during manufacturing of processed cheese, affecting chemical reactions, such as hydrophobic interactions, electrostatic bonds, calcium bonds, and hydrogen bonds (Marchesseau et al., 1997).
Processed cheese formulated with 1% ES and treated with 432 J/g energy density showed a viscosity of 900 cP. No significant difference (p > 0.05) was observed between processed cheese formulated with 1% and 2% ES, but significant differences were observed, compared to processed cheese formulated with 3% ES.
Hardness
The hardness of processed cheese is a key characteristic reflecting its texture and firmness. Mean hardness values (g) of both processed cheese and processed cheese treated with ultrasound, determined by TPA, are presented in Table 4. Processed cheese formulated with 2% ES exhibited hardness values of 49.97 g for control, and 48.93, 54.63, 46.23, and 40.55 g for T1, T2, and T3 treatments, respectively. No significant difference (p > 0.05) was found between processed cheese formulated with 2% ES and processed cheese treated with ultrasound. For processed cheese formulated with 3% ES, hardness values were 64.3 g for control, and 57.83, 58.70, 70.48, and 56.25 g for T1, T2, and T3 treatments, respectively. Ultrasound treatment did not significantly affect (p > 0.05) the hardness of processed cheese across treatments. However, a significant difference (p < 0.05) was observed between processed cheese formulated with 2% and 3% ES, with processed cheese containing 3% ES showing more hardness. Processed cheese formulated with 1% ES and treated with 432 J/g energy density exhibited a hardness of 31.0 g. No significant difference (p > 0.05) was observed between processed cheese formulated with 1% and 2% ES, but a significant difference was observed if compared to processed cheese formulated with 3% ES. The hardness of processed cheese is influenced by factors such as the final pH of processed cheese, and type and amount of ES (Stampanoni and Noble, 1991), which affect residual calcium in casein structure. Lower calcium residues typically result in hardness of higher processed cheese (Lu et al., 2008).
Scheiber melting test
The Scheiber melting test assesses the meltability of processed cheese, a crucial attribute for its application and consumer appeal. Results of the Scheiber melting test for processed cheese formulated with 2% ES showed melting areas of 38.06 mm for control, and 35.70, 33.47, 34.09, and 33.46 mm for T1, T2, and T3 treatments, respectively. Significant differences (p < 0.05) in the melting area were observed between T2, T3, and T4 treatments, compared to the control. Treatment T1 did not differ significantly from the control, probably because of the energy density applied, inducing an irreversible gel formation that enhances processed cheese’s melting characteristics (Brickley et al., 2007). Ultrasound treatment decreased the melting area of processed cheese, indicating that processed cheese treated with ultrasound did not exhibit easier melting, compared to the control. For processed cheese formulated with 3% ES, melting areas were 29.89 mm for the control, and 29.25, 30.65, 33.62, and 29.56 mm for T1, T2, T3, and T4 treatments, respectively. Significant differences (p < 0.05) were observed between T3 and T4 treatments, compared to the control. Processed cheese formulated with 1% ES and treated with 432 J/g energy density had a melting area of 33.62 mm. No significant difference (p > 0.05) was discovered between processed cheese formulated with 1% and 2% ES, but a significant difference was observed, compared to the processed cheese formulated with 3% ES. These findings underscore the influence of ES and ultrasound treatment on the meltability of processed cheese, impacting its application in various culinary and food service contexts.
Melting temperature
The melting temperature of processed cheese is a critical indicator of its thermal behavior and functional properties. Dynamic rheological analysis was employed to determine the melting temperature, identified as the temperature where tan δ (G″/G') = 1, marking the transition from elastic to viscous behavior (Prow and Metzger, 2005). The mean melting temperatures (°C) of both processed cheese and processed cheese treated with ultrasound at different levels of ES are summarized in Table 5. For the processed cheese formulated with 2% ES, the melting temperatures were 45.30°C for the control, and 49.44, 47.40, 46.73, and 40.62°C for T1, T2, T3, and T4 treatments, respectively. No significant differences (p > 0.05) were observed between T1, T2, T3, T4 treatments and the control. The lower melting temperature observed in T4 treatment could be attributed to the heat generated during ultrasound treatment, which enhanced the formation of a heat-induced irreversible gel, thereby improving the melt characteristics of processed cheese (Brickley et al., 2007). For processed cheese formulated with 3% ES, the melting temperatures were 60.59°C for the control, and 57.53, 57.88, 63.66, and 57.89°C for T1, T2, T3, and T4 treatments, respectively. No significant differences (p > 0.05) were observed between T1, T2, T3, T4 treatments and the control. Processed cheese formulated with 1% ES and treated with 432 J/g energy density exhibited a melting temperature of 36.57°C. No significant difference (p > 0.05) was found between processed cheese formulated with 1% and 2% ES, but a significant difference was observed, compared to the processed cheese formulated with 3% ES. This variation could be attributed to the level of ES used in processed cheese formulation, which had a vital role in determining its melting characteristics (Marchesseau et al., 1997). Higher levels of ES typically result in higher melt temperatures for processed cheese formulations.
Table 5. The Scheiber melt test and melting temperature (°C) (n = 3) of both processed cheese and processed cheese treated with ultrasound at different concentrations of ES.
| Composition | Treatments* | ||||||||||
|---|---|---|---|---|---|---|---|---|---|---|---|
| Control | T1 | T2 | T3 | T4 | |||||||
| 2% | 3% | 2% | 3% | 2% | 3% | 2% | 3% | 1% | 2% | 3% | |
| Scheiber melt test (mm) | 38.06a | 29.89b | 35.70a,b | 29.25b | 33.47b,c | 30.65c,b | 34.09b,c | 33.62b,c | 33.62c | 33.46b,c | 29.56d |
| Melting temperature (°C) | 45.30c,d,e | 60.59a,b | 49.44b,c,d | 57.53a,b,c | 47.40c,d,e | 57.88a,b,c | 46.73c,d,e | 63.66a | 36.57e | 40.62d,e | 57.89a,b,c |
*Treatments consisted of the following: control, which used processed cheese made with disodium phosphate; T1, processed cheese treated with ultrasound at 58.5 J/g; T2, processed cheese treated with ultrasound at 175.5 J/g; T3, processed cheese treated with ultrasound at 144 J/g; and T4, processed cheese treated with ultrasound at 432 J/g.
a,b,c,d,eMeans in the same column not sharing a common superscript are different at (P < 0.05).
Conclusions
This study investigated the effects of ultrasound treatment on processed cheese formulations at 432 J/g and with varying levels of ES. The findings indicated that ultrasound treatment did not significantly alter the physical and chemical properties of processed cheese. However, the level of ES had a notable impact on these properties. It was observed that higher levels of ES resulted in increased viscosity, hardness, and melting temperature as well as reduced melting area of processed cheese. These findings suggested that the choice of ES in processed cheese formulation plays a crucial role in determining its functional characteristics. Overall, ultrasound showed a promise as a technology in the cheese manufacturing industry, particularly when applied with appropriate energy density and duration. Further research could explore optimizing ultrasound parameters to enhance specific properties of processed cheese.
Funding
The author gratefully acknowledge Qassim University, represented by the Deanship of Scientific Research, on the financial support for this research under the number (20035-cavm-2023-8-28-W) during the academic year 1445AH / 2023 AD.
REFERENCES
Alsaleem, Khalid A. 2022. A Process to Produce Lactose Phosphate from Dairy By-products and Used as an Alternative to Emulsifying Salts in Processed Cheese Food Manufacture. South Dakota State University, Brookings, SD.
Alsaleem, Khalid A., Hammam, A.R.A., and Awasti, N. 2021. Selvamuthukumaran, M., & Maqsood, S. (Eds.). Safety, regulatory aspects and environmental impacts of using non-thermal processing techniques for dairy industries. In: Non-Thermal Processing Technologies for the Dairy Industry. CRC Press, Boca Raton, USA, pp. 157–172. 10.1201/9781003138716-12
Alsaleem, Khalid A., Hammam, A.R.A., and Metzger, L.E. 2024. Lactose-6-phosphate as an alternative to disodium phosphate in the production of processed cheese food. J Dairy Sci. 107(6): 3420–3428. 10.3168/jds.2023-24157
Benedito, J., Carcel, J.A., Gonzalez, R., and Mulet, A. 2002. Application of low intensity ultrasonics to cheese manufacturing processes. Ultrasonics. 40(1–8): 19–23. 10.1016/S0041-624X(02)00085-9
Bermúdez-Aguirre, D., and Barbosa-Cánovas, G.V. 2008. Study of butter fat content in milk on the inactivation of Listeria innocua ATCC 51742 by thermo-sonication. Innovat Food Sci Emerg Technol. 9(2): 176–185. 10.1016/j.ifset.2007.07.008
Bermúdez-Aguirre, D., Mawson, R., Versteeg, K., and Barbosa-Cánovas, G.V. 2009. Composition properties, physicochemical characteristics and shelf life of whole milk after thermal and thermo-sonication treatments. J Food Qual. 32(3): 283–302. 10.1111/j.1745-4557.2009.00250.x
Brickley, C.A., Auty, M.A.E., Piraino, P., and McSweeney, P.L.H. 2007. The effect of natural cheddar cheese ripening on the functional and textural properties of the processed cheese manufactured therefrom. J Food Sci. 72(9): C483–C490. 10.1111/j.1750-3841.2007.00539.x
Caric, M., Gantar, M., and Kalab, M. 1985. Effects of emulsifying agents on the microstructure and other characteristics of process cheese-a review. Food Struct. 4(2): 13.
Hammam, A.R.A., Kapoor, R., Salunke, P., and Metzger, L.E. 2021a. Compositional and functional characteristics of feta-type cheese made from micellar casein concentrate. Foods. 11(1): 24. 10.3390/foods11010024
Hammam, A.R.A., Martinez-Monteagudo, S.I., Metzger, L.E., and Alsaleem, K.A. 2021b. Effect of ultrasound intensity on the functional characteristics of rennet-coagulated skim milk. J Food Proc Eng. 44(9): e13800. 10.1111/jfpe.13800
Jambrak, A.R., Mason, T.J., Lelas, V., Paniwnyk, L., and Herceg, Z. 2014. Effect of ultrasound treatment on particle size and molecular weight of whey proteins. J Food Eng. 121: 15–23. 10.1016/j.jfoodeng.2013.08.012
Kapoor, R., and Metzger, L.E. 2008. Process cheese: scientific and technological aspects—a review. Comp Rev Food Sci Food Safety. 7(2): 194–214. 10.1111/j.1541-4337.2008.00040.x
Liu, Z., Juliano, P., Williams, R.P.W., Niere, J., and Augustin, M.A. 2014. Ultrasound improves the renneting properties of milk. Ultrason Sonochem. 21(6): 2131–2137. 10.1016/j.ultsonch.2014.03.034
Lu, Y., Shirashoji, N., and Lucey, J.A. 2008. Effects of pH on the textural properties and meltability of pasteurized process cheese made with different types of emulsifying salts. J Food Sci. 73(8): E363–E369. 10.1111/j.1750-3841.2008.00914.x
Madadlou, A., Emam-Djomeh, Z., Mousavi, M.E., Mohamadifar, M., and Ehsani, M. 2010. Acid-induced gelation behavior of sonicated casein solutions. Ultrason Sonochem. 17(1): 153–158. 10.1016/j.ultsonch.2009.06.009
Marchesseau, S., Gastaldi, E., Lagaude, A., and Cuq, J.-L. 1997. Influence of pH on protein interactions and microstructure of process cheese. J Dairy Sci. 80(8): 1483–1489. 10.3168/jds.S0022-0302(97)76076-4
Monteiro, S.H.M.C., Silva, E.K., Alvarenga, V.O., Moraes, J., Freitas, M.Q., Silva, M.C., et al. 2018. Effects of ultrasound energy density on the non-thermal pasteurization of chocolate milk beverage. Ultrason Sonochem. 42: 1–10. 10.1016/j.ultsonch.2017.11.015
Nguyen, N.H.A., and Anema, S.G. 2010. Effect of ultrasonication on the properties of skimmed milk used in the formation of acid gels. Innov Food Sci Emerg Technol. 11(4): 616–622. 10.1016/j.ifset.2010.05.006
Pingret, D., Fabiano-Tixier, A., Petitcolas, E., Canselier, J., and Chemat, F. 2011. First investigation on ultrasound-assisted preparation of food products: sensory and physicochemical characteristics. J Food Sci. 76(2): C287–C292. 10.1111/j.1750-3841.2010.02019.x
Prow, L.A., and Metzger, L.E. 2005. Melt analysis of process cheese spread or product using a rapid visco analyzer. J Dairy Sci. 88(4): 1277–1287. 10.3168/jds.S0022-0302(05)72794-6
Ragab, E.S., Zhang, S., Pang, X., Lu, J., Nassar, K.S., Yang, B., Obaroakpo, U.J., and Lv, J. 2020. Ultrasound improves the rheological properties and microstructure of rennet-induced gel from goat milk. Int Dairy J. 104: 104642. 10.1016/j.idairyj.2020.104642
Shanmugam, A., Chandrapala, J., and Ashokkumar, M. 2012. The effect of ultrasound on the physical and functional properties of skim milk. Innovat Food Sci Emerg Technol. 16: 251–258. 10.1016/j.ifset.2012.06.005
StampanonI, C.R., and Noble, A.C. 1991. The influence of fat, acid, and salt on the perception of selected taste and texture attributes of cheese analogs: a scalar study. J Texture Stud. 22(4): 367–380. 10.1111/j.1745-4603.1991.tb00499.x
Terefe, N.S., Sikes, A.L., and Juliano, P. 2016. Knoerzer, K., Juliano, P., & Smithers, G. W. (Eds.). Ultrasound for structural modification of food products. In: Innovative Food Processing Technologies. Elsevier, pp. 209–230. 10.1016/B978-0-08-100294-0.00008-0
Wu, H., Hulbert, G.J., and Mount, J.R. 2000. Effects of ultrasound on milk homogenization and fermentation with yogurt starter. Innovat Food Sci Emerg Technol. 1(3): 211–218. 10.1016/S1466-8564(00)00020-5
Zhao, L., Zhang, S., Uluko, H., Liu, L., Lu, J., Xue, H., Kong, F., and Lv, J. 2014. Effect of ultrasound pretreatment on rennet-induced coagulation properties of goat’s milk. Food Chem. 165: 167–174. 10.1016/j.foodchem.2014.05.081