
Download
Phycocyanin g / L = OD 615 − 0.474 OD 652 5.34 . 1 d A d t = − D c . t , 2 ln A A 0 = − D c . t , 3 t 1 / 2 = L n 2 D C . 4
ORIGINAL ARTICLE
The stability of phycocyanin extracted from Arthrospira platensis against osmotic, acid, and temperature stress conditions
Niloofar Shafieiyoun1, Mahshid Jahadi1*, Kianoush Khosravi-Darani2*
1Department of Food Science and Technology, Faculty of Agriculture, Isfahan (Khorasgan) Branch, Islamic Azad University, Isfahan, Iran;
2Department of Food Technology Research, Faculty of Nutrition Sciences and Food Technology, National Nutrition and Food Technology Research Institute, Shahid Beheshti University of Medical Sciences, Tehran, Iran
Abstract
The main problem of using natural blue pigment of phycocyanin produced by Arthrospira platensis (spirulina) is its instability in the food matrix because of environmental stress. This study aimed to investigate the stability of phycocyanin under simulated conditions in food formulations against osmotic, acid, and temperature stress conditions. Thermal degradation constant (Dc) and half-life (t½) of phycocyanin extracted from Arthrospira platensis were analyzed using response surface methodology followed by a first-order kinetic reaction. The stability of phycocyanin was assessed under various temperature (50–98ºC), NaCl (0–2% w/w), and pH (4–7) values. Results showed that the stability of phycocyanin extracted from Arthrospira platensis is high at neutral pH and concentration of 1% (w/w) NaCl. The stability decreased with increase in temperature at ≥75°C. The highest stability of phycocyanin (the lowest Dc and the maximum t½ were 0.011 min-1 and 54.03 min, respectively) was achieved at 66.89°C, pH = 6.6, and NaCl of 0.40% w/w. According to processing conditions, content of phycocyanin required for a food matrix is successfully calculated by the response surface method. This research showed that phycocyanin is stable at thermal shock in a neutral pH medium and low content of NaCl (0.40% w/w).
Key words: arthrospira platensis, phycocyanin, response surface methodology, spirulina, stability
*Corresponding Authors: Kianoush Khosravi-Darani, Professor of Food Biotechnology, National Nutrition and Food Technology Research Institute, Faculty of Nutrition Sciences and Food Technology, Shahid Beheshti University of Medical Science, P.O. Box: 19395-4741, Tehran, Iran. Email: [email protected]. Mahshid Jahadi, Professor of Food Technology, Department of Food Science and Technology, Faculty of Agriculture, Isfahan (Khorasgan) Branch, Islamic Azad University, Isfahan, Iran. Email: [email protected]
Received: 31 January 2024; Accepted: 2 June 2024; Published: 12 July 2024
© 2024 Codon Publications
This is an Open Access article distributed under the terms of the Creative Commons Attribution-NonCommercial-ShareAlike 4.0 International (CC BY-NC-SA 4.0). License (http://creativecommons.org/licenses/by-nc-sa/4.0/)
Introduction
Microalgae Arthrospira (A.) platensis (spirulina) has been considered as one of the important targets of biotechno-logical research because of its economic, ecological, and nutritional significance. A. platensis algae is of particular importance in the food industry (Beheshtipour et al., 2012, 2013; Hoseini et al., 2013a; Massoud et al., 2015; Mazinani et al., 2016), medical sector (anti- inflammatory and anticancer with several kidney and liver protective properties; Hoseini et al., 2013b; Soheili et al., 2011), and aquaculture industry because of its digestibility and high nutritional value (50–70% w/w protein) and also having essential amino acids, vitamins, mineral elements, and essential fatty acids (Fernández-Rojas et al., 2014). A. platensis produces high amounts of phycobili proteins (Antelo et al., 2008) and significant amounts of natural pigments chlorophyll, carotenoid, and phycocyanin (Banayan et al., 2020; Ghaeni et al., 2014; Santiago-Morales et al., 2018).
Phycocyanin is a blue pigment and light receptor with antioxidant and fluorescent properties in cyanobacteria. This pigment is a water-soluble compound with high antioxidant properties. The blue powder of phycocyanin is nontoxic, odorless, and slightly sweet. Phycocyanin and other phycobiliproteins (PBPs) are used in chewing gum, chocolate, jellies, beverages, cosmetic health industries, and disease diagnosis (Ansarifard et al., 2017).
The photoautotrophic production of phycocyanin by A. platensis is carried out in photobioreactors (PBRs; Panutai et al., 2020) and/or open large ponds or pools in tropical or subtropical areas at the edges of oceans. Biomass production efficiency is modified by supply of light. A. platensis grows in mixotrophic cultures; therefore, the conditions for growth and production of phycocyanin are optimized by providing suitable level of light and organic carbon sources (Banayan et al., 2020; Soheili et al., 2013).
Many researchers have optimized cultivation to increase production efficiency and reduce production costs of this pigment. The effect of carbon and nitrogen sources as well as exposure period and intensity of light on the production of phycocyanin is investigated (Banayan et al., 2020; Chen and Zhang, 1997). The extraction efficiency, purity, and concentration of phycocyanin depend on the process of cell disruption. Various methods of extraction, such as the use of lysozyme, ethylenediaminetetraacetic acid (EDTA), and phosphate buffer, are used to extract phycocyanin. Lysozyme affects the cell wall more, and EDTA and phosphate buffer release phycocyanin by chelating magnesium ions and destroying the cytoplasmic membrane. Ultrasound, homogenization, freezing, and thawing techniques, as well as organic and inorganic solvents, are applied for the extraction of phycocyanin (Safari et al., 2018).
The degradation of phycocyanin depends on its protein structure, which is affected by many factors, such as light, pH, temperature, and protein concentration. Hence, stabilizing substances are used to maintain the protein structure (Sarada et al., 1999). Research has shown that phycocyanin is more stable in cold temperature and acidic pH 5–5.4. Increase in temperature to more than 70°C leads to fast denaturation of phycocyanin (Safari et al., 2018). The proteinaceous nature of phycocyanin protects this pigment to be less affected by contamination and microbial decomposition at low temperatures and to denature at high temperatures. Phycocyanin extract is more stable at 50–55°C (Doke, 2005).
Many researchers have focused on thermal stability and prediction of the degradation rate of natural pigments used in food matrices. Thermal analysis of sweet potato purple anthocyanins at 90°C and pH of 3–7 showed that content of anthocyanin decreased with increase in heating time at all pH values and especially in neutral conditions (pH 7; Li et al., 2013). The anthocyanins obtained from red radish extract are much more resistant at pH 5 than at pH 3 (Wang et al., 2017). Modeling of thermal degradation constant (Dc) and half-life (t½) of Monascos poroporeus was successfully carried out to predict its degradation rate and survival in food processes (Abdollahi et al., 2021). To the best of our knowledge, there is no report about modeling and predicting the behavior of phycocyanin stability against osmotic, temperature, and acid stress conditions in food matrices.
This study was designed to investigate the effect of temperature, pH, and salt on the stability of phycocyanin in simulated food conditions. Modeling of the effect of temperature (50–98°C), pH (4–7), and salt (0–2% w/w) on Dc and t½ of phycocyanin was carried out by the response surface method (RSM). By controlling pigment degradation in thermal processes, similar conditions are predicted and the desired pigment content in food is calculated.
Material and Methods
Microalgae source and culture condition
The microalgae strain (A. platensis, APP1) was provided by the Microalgae Culture Collection of Tarbiat Modares University, Tehran, Iran. A. platensis was cultivated using Zarrouk media (pH 9.8) in 250-mL glass flasks containing 150 mL of cell suspension under sterile conditions. Growth and maintenance of the culture were carried out using illuminated (150 µmol m2 s-1) phytotron at 30±1°C under a 12–12-h light–dark cycle with mild agitation (100 rpm) for 12 days (Banayan et al., 2020; Gami et al., 2011; Zeng et al. 2012).
Phycocyanin extraction
To extract and measure phycocyanin pigment, freezed biomass and 0.15-M potassium phosphate buffer (pH = 7) were mixed at a ratio of 1:50 v/v. Then, the cell suspension was centrifuged (Universal 320R made in Iran) at 1800 g for 10 min at 25°C. Pellets were removed and the supernatant was collected. Absorbance of the extract was measured with an ultraviolet-visible (UV-VIS) spectrophotometer (2100 model; UNICO, China) at 615 nm and 652 nm, and the concentration of phycocyanin was calculated according to Equation (1) (Banayan et al., 2020; Ferreira-Santos et al., 2020):
Calculation of reaction kinetics
Effects of temperature (50–98°C), NaCl (0–2% w/w), and pH (4.3–7.7) on Dc and t½ of phycocyanin extracted from A. platensis were assessed using a water bath. Phycocyanin solutions were heated for 30 min in a water bath (50–98°C), and samples were collected after 5 min. Degradation constant obtained in the first-order kinetic model was expressed according to Equation (2). Regression lines were obtained by plotting changes in the degradation of phycocyanin logarithmically as a function of heat treatment time (Vendruscolo et al., 2013):
where A is the amount of phycocyanin (g/L), A0 is the amount of phycocyanin at t = 0, t is the time (minute), and Dc is the color instability constant because of heat (min-1). Equation (2) had a logarithmic graph in Equation (3). To convert it into a linear graph, boundary conditions must be used for each parameter. The t½ was obtained from the Dc parameter given in Equation (4), where t½ means the time when the amount of phycocyanin was twice the amount of initial phycocyanin:
Statistical analysis
In this study, temperature (50–98°C), pH (4–7), and NaCl content (0–2% w/w) were analyzed as independent variables using central composite design (CCD) of response surface methodology (RSM) and the Expert Design Software v.7.0.0. Levels of real variables in CCD are shown in Table 1. Effects of significant independent variables were assessed in terms of DC (Y1) and t½ (Y2) of phycocyanin. The research was designed by applying RSM with α = 1.7. Data were analyzed by the Design 7.0.0 Expert software at 95% confidence level (95% CI).
Table 1. Degradation constant (Dc) and half-life (t½) for various heat treatments, pH, and salt proportions of phycocyanin produced by Arthrospira platensis (spirulina).
| Run No. | Independent variables | Responses | |||
|---|---|---|---|---|---|
| Temperature (ºC) (A) |
NaCl (%) (B) |
pH (C) |
Degradation constant, Dc (min-1) | Half-life, t½ (min) | |
| 1. | 59.7 | 0.44 | 4.6 | 0.0169 | 40.01 |
| 2. | 88.3 | 0.44 | 4.6 | 0.0198 | 35.01 |
| 3. | 59.7 | 0.44 | 6.4 | 0.0118 | 58.74 |
| 4. | 88.3 | 0.44 | 6.4 | 0.0152 | 45.60 |
| 5. | 59.7 | 1.6 | 4.6 | 0.0177 | 39.16 |
| 6. | 88.3 | 1.6 | 4.6 | 0.0122 | 56.82 |
| 7. | 59.7 | 1.6 | 6.4 | 0.0199 | 34.83 |
| 8. | 88.3 | 1.6 | 6.4 | 0.0167 | 41.51 |
| 9. | 50 | 1.0 | 5.5 | 0.0169 | 41.01 |
| 10. | 98 | 1.0 | 5.5 | 0.0211 | 32.85 |
| 11. | 74 | 1.0 | 4 | 0.0192 | 36.10 |
| 12. | 74 | 1.0 | 7 | 0.0169 | 41.01 |
| 13. | 74 | 0 | 5.5 | 0.0138 | 50.23 |
| 14. | 74 | 2.0 | 5.5 | 0.0128 | 54.15 |
| 15. | 74 | 1.0 | 5.5 | 0.0133 | 52.12 |
| 16. | 74 | 1.0 | 5.5 | 0.0123 | 56.45 |
Results and Discussion
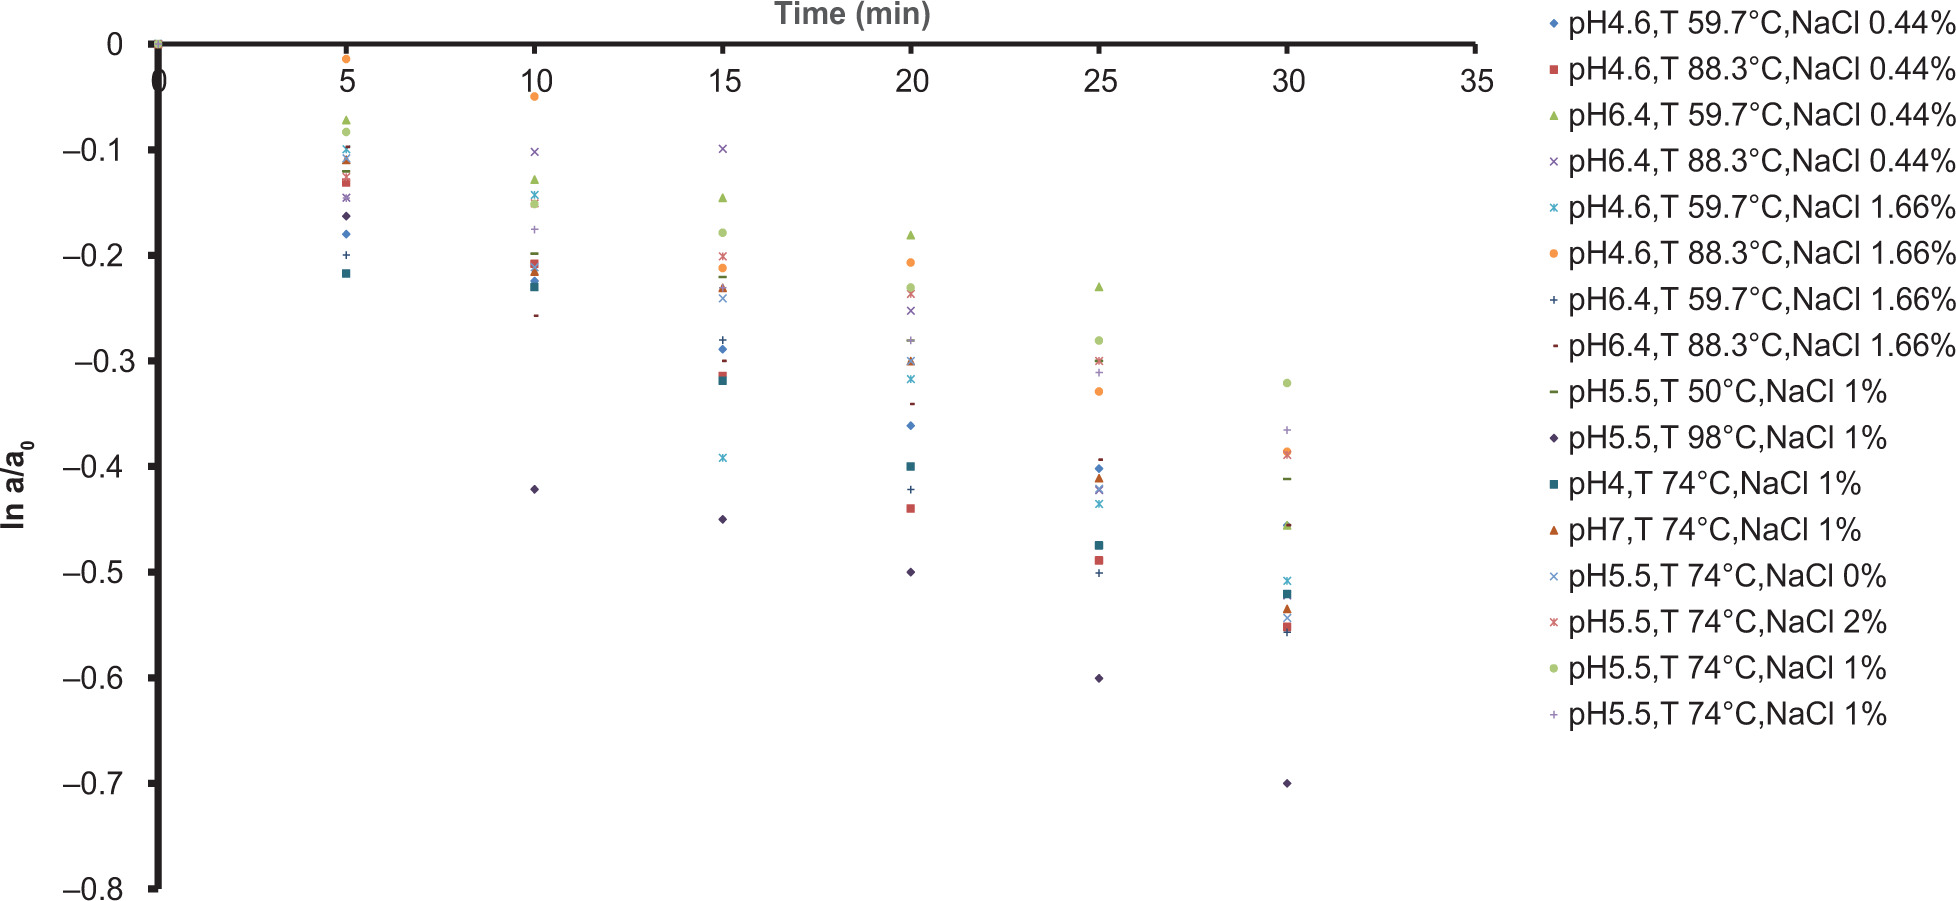
Table 1 shows the effect of independent variables of temperature (50–98°C), pH (4–7), and NaCl (0–2% w/w) on the constant variables of phycocyanin pigment instability, Dc and t½. Figure 1 shows changes in phycocyanin color degradation after exposure to 17 treatment combinations. Since the graph is logarithmic, ln(A/A0) was used to linearize the same. The weakening of phycocyanin pigment during the heating period of 5 min is shown in Figure 1, where the slope of the line is the Dc of the pigment. As shown in Figure 1, placed for 30 min, the highest degradation was related to treatment 10 at a temperature of 98°C, pH = 5.5, and salt concentration of 1% w/w, and the lowest degradation was related to treatment 3, which was at a temperature of 59.7°C, pH = 6.4, and salt concentration of 0.44% w/w.
Figure 1. Degradation constant (Dc) of the phycocyanin produced by Arthrospira platensis (spirulina) in aqueous solution versus various conditions (temperature: 50–98°C; pH 4–7, and salt content: 0–2%).
The results of the final analysis of variance presented in Table 2 show that the model was significant (p < 0.0006) and the lack of fit was not significant (p = 0.99). The distribution of statistical data in samples was suitable (CV = 8.22). The value of regression coefficient, R2, was 0.9060 and showed significant relationships between experimental and predicted values according to Equation (5):
Table 2. Effects of (A) temperature, (B) pH, and (C) salt and their interactions on Dc and t1/2 of phycocyanin produced by Arthrospira platensis (spirulina) using response surface method (RSM).
| Source | Degradation constant (Dc) | Half-life (t½) | |||||
|---|---|---|---|---|---|---|---|
| Degree of freedom | Sum of squares | F value | p value | Sum of squares | F value | p value | |
| Model | 7 | 0.0001 | 12.40 | 0.006 | 1,229.68 | 10.08 | 0.001 |
| Temperature (A) | 1 | 1.592E-06 | 0.94 | 0.35 | 5.35 | 0.3037 | 0.593 |
| pH (B) | 1 | 3.454E-06 | 2.06 | 0.18 | 21.03 | 1.21 | 0.30 |
| NaCl (C) | 1 | 9.156E-08 | 0.0546 | 0.82 | 0.1544 | 0.0089 | 0.92 |
| AC | 1 | 0.0000 | 16.77 | 0.002 | 236.26 | 13.56 | 0.005 |
| BC | 1 | 0.0000 | 20.04 | 0.001 | 287.52 | 16.50 | 0.002 |
| A2 | 1 | 0.0001 | 33.54 | 0.00 | 457.72 | 26.27 | 0.0006 |
| B2 | 1 | 0.0000 | 23.82 | 0.009 | 375.37 | 21.54 | 0.001 |
| Residual error | 9 | 0.0000 | 156.81 | ||||
| Lack of fit | 7 | 0.0000 | 10.2 | 0.99 | 119.08 | 0.9019 | 0.61 |
| Pure error | 2 | 1.807E-06 | 37.72 | ||||
| Total | 16 | 0.0002 | 1,386.48 | ||||
| R2: 0.9096 | R2: 0.88 | ||||||
| CV: 8.22% | CV: 9.13% | ||||||
Dc = 0.0126 + 0.0003 A – 0.0005 B + 0.0001 C – 0.0019 AC + 0.0021 BC + 0.0021 A2 + 0.0018 B2 (5)
In which A, B, and C are Temperature (ºC), NaCl (%), and pH. Also, AC and BC are interaction effects and A2 & B2 are quadratic effect of main factors A, B, C.
The t½ indicates the stability of phycocyanin under processing conditions. In other words, the t½ is the time taken by the pigment to reach half of its initial amount. The t½ of a pigment has an inverse relationship with its thermal instability (Dc) (Abdollahi et al., 2021). As the results of the analysis of variance showed, the model was significant (p < 0.0013), error in the lack of fit was not significant (p = 0.6183), and the value of regression coefficient, R2, was 0.8869.
The experimentally obtained data for t½ and coefficient of variables led to an objective function as shown in Equation (6):
t½ = 55.05 + (0.625 A)+(1.24 B) – (0.106 C) + (5.34 AC) – (5.9 BC) – (6.09 A2) – (5.51 B2) (6)
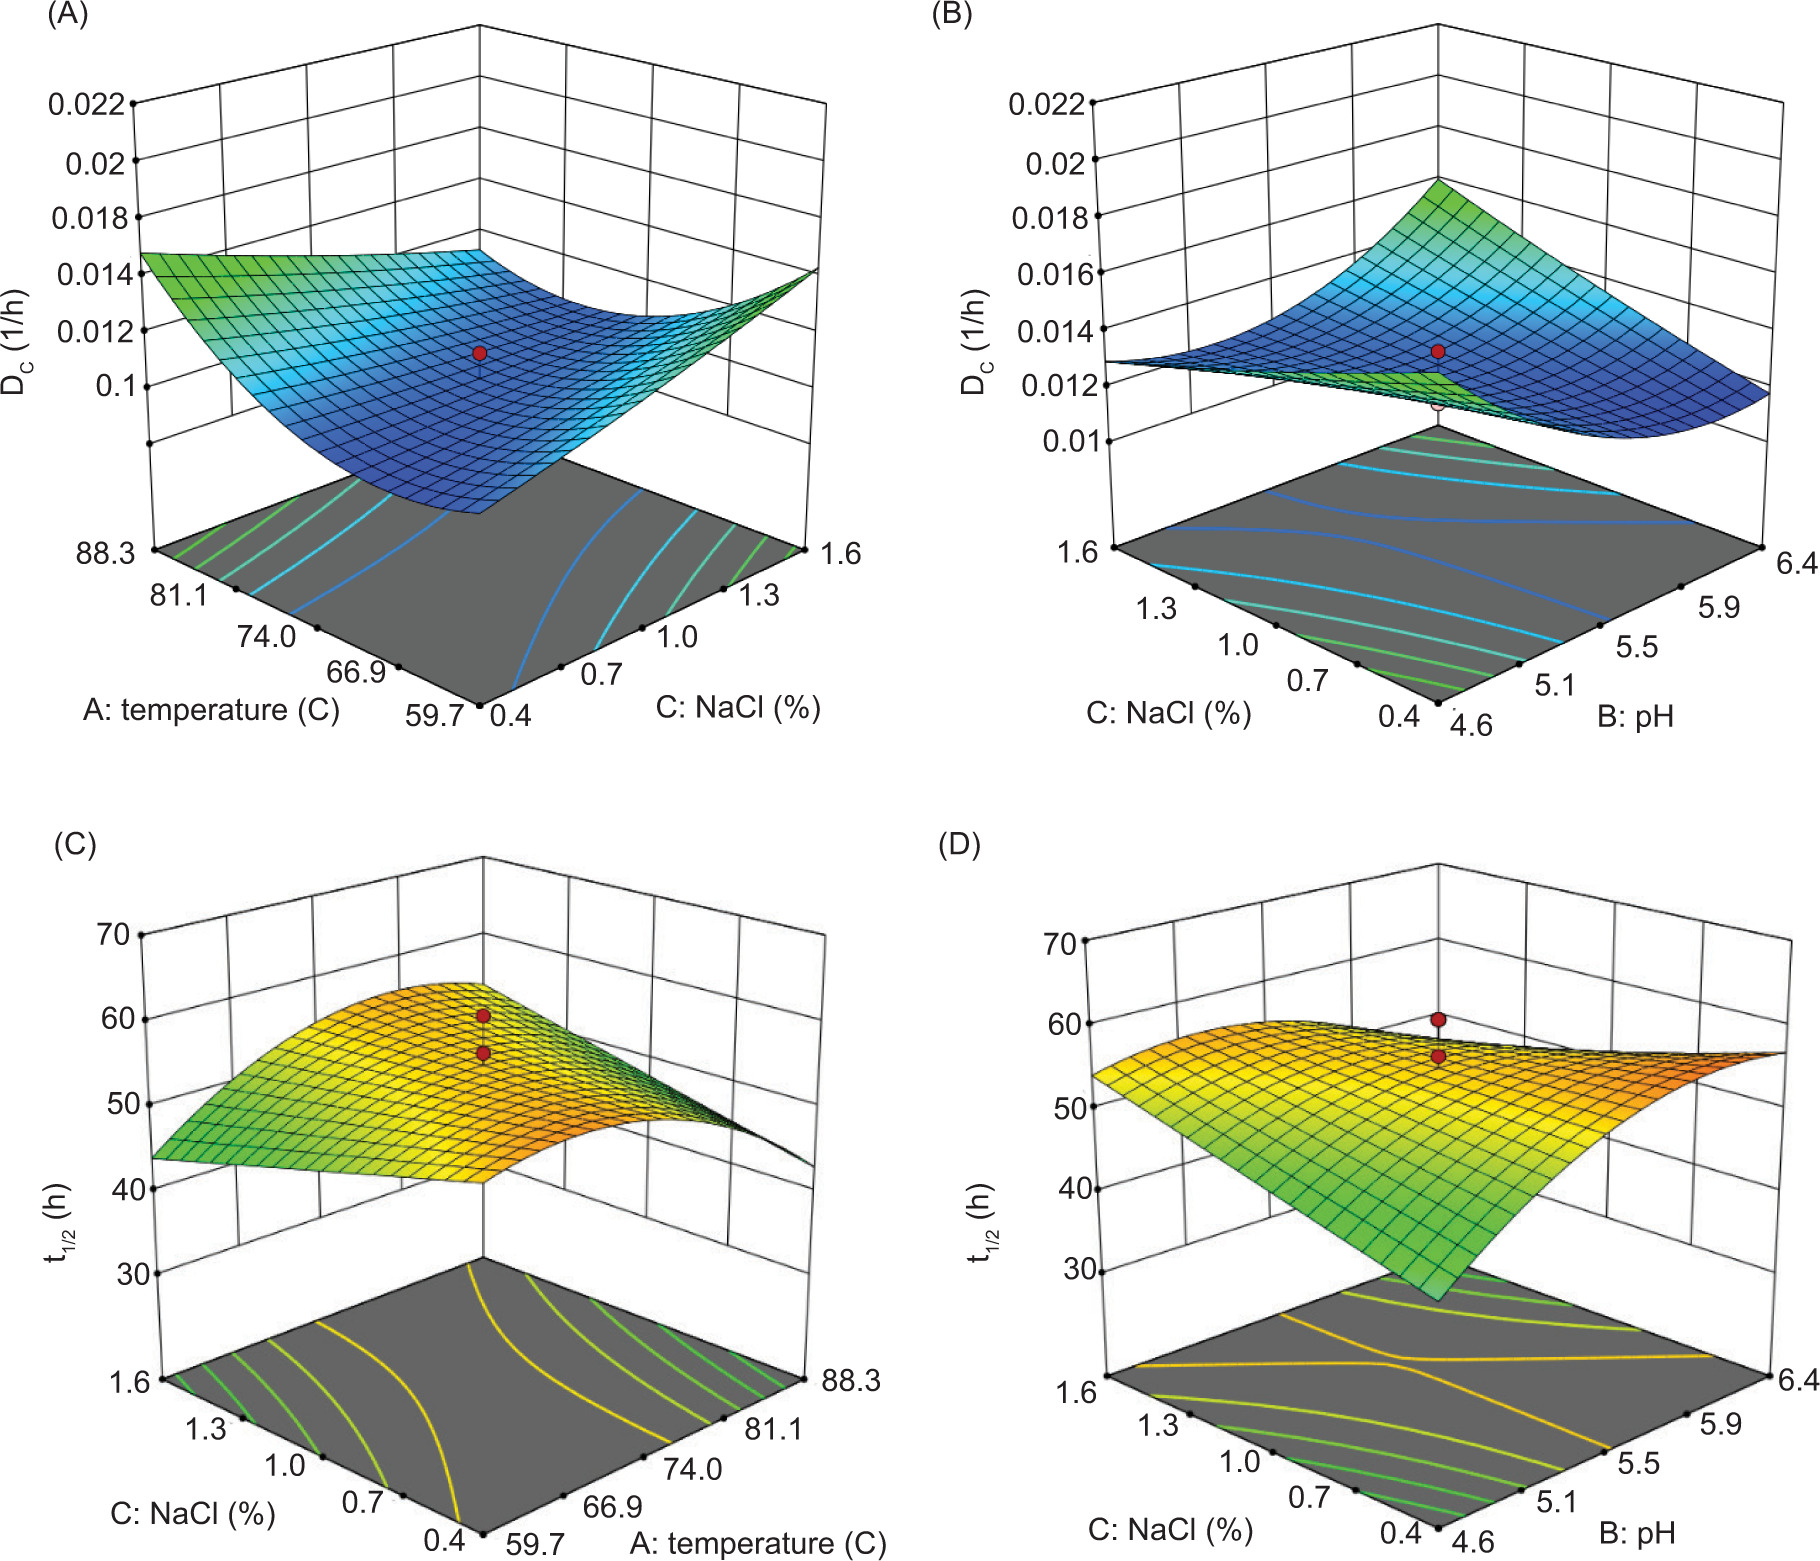
The linear effects of temperature, pH, and NaCl content and interaction of temperature–NaCl and pH–NaCl were significant on Dc and t½ of phycocyanin (Table 2). Furthermore, the square effect of temperature and pH was significant (p < 0.05). With increasing temperature, stability of phycocyanin decreased to a minimum level of about 5.5. Figures 2B and 2D show that the interaction of salt and pH was significantly effective on both Dc and t½ of phycocyanin (p ≤ 0.05). At pH = 6.4, Dc increased with increasing salt, while at pH = 4.6, changes in salt had no effect on it.
Figure 2. The 3D response surface plot demonstrating effects of: (A) temperature and pH and (B) NaCl and pH on the thermal degradation constant (Dc); and (C) temperature and pH and (D) NaCl and pH on half-life (t½) of phycocyanin.
The results of the present study showed that at pH > 4.6, Dc of phycocyanin increased with increase in salt content. At low temperatures, addition of salt maintained the stability of the pigment. Also, at a temperature of 59.7°C, pH = 6.4, and a salt content of 0.44% w/w, the lowest Dc (0.011) and maximum t½ (58.74 min) were observed. The Dc of phycocyanin increased and t½ of phycocyanin decreased with increasing temperature (Figures 2A and 2C). The t½ of phycocyanin increased if preservatives were used (Martelli et al., 2014).
Phycocyanin is a heat-sensitive protein. Increase in temperature destroys the protein structure of phycocyanin because at high temperatures, structure of the protein is affected by heating, breaking down of bonds between and within the chain. Therefore, the stability of phycocyanin decreases (Chaiklahan et al., 2012). This change is irreversible (Doke, 2005). Decreased color stability because of high temperatures is expected in most natural colors (Priatni, 2015).
Under thermal processing, minimum changes in phycocyanin pigment occur at a temperature of 59.7°C, and maximum degradation occurs at a temperature of more than 88.3°C. Degradation of the pigment is slow at a temperature of 26–43°C, but the rate of degradation is faster at a temperature of 47–64°C and the pigment is destroyed at a temperature of more than 64°C (Chaiklahan et al., 2012; Doke, 2005).
Salt stabilizes phycocyanin by covering the surface of phycocyanin and changing its structure (Chaiklahan et al., 2012; Hadiyanto et al., 2019; Martelli et al., 2014). Hence, the addition of NaCl at a concentration of more than 1% w/w prevents phycocyanin degradation by more than 50–70% (Chaiklahan et al., 2012). Use of preservatives decreases Dc but increases t½ of phycocyanin (Figure 2).
One of the effective parameters in the degradation of phycocyanin pigment under different thermal processing conditions is pH. The results showed that the lowest degradation was at pH = 5.5, hence under these conditions, the lowest Dc and the highest t½ of phycocyanin were observed (Figures 2B and 2D). Phycocyanin is much more stable at pH = 5 than 6 but shows more instability at pH = 7 (Antelo et al., 2008). Because of the protein-aceous nature of phycocyanin, pH depends on temperature and other environmental conditions (Chaiklahan et al., 2012; Priatni, 2015). By investigating the addition of preservatives to food formulations, degradation of the protein part of the pigment is delayed. Therefore, the Dc and t½ of phycocyanin pigment decreases and increases, respectively. The use of different preservatives, such as NaCl, amino acids, and sorbitol, increases the stability of phycocyanin at different temperatures and pH conditions (Barbiroli et al. 2017; Hadiyanto et al., 2019).
Conclusions
The results of the current study demonstrated the stability of phycocyanin produced by A. platensis under the stress conditions of temperature, NaCl, and pH shocks. Kinetic model for the thermal degradation of aqueous phycocyanin produced by A. platensis was validated as the first-order model. In general, Dc increased and t½ of the pigment decreased with increase in temperature. Instability of the pigment decreased with increase in pH from 4 to 5.5 at high temperatures. In addition, salt stress played a protective role regarding stability of the pigment. Modeling and predicting the degradation of phycocyanin in food products by the response surface method provided the possibility of calculating and designing the exact amount of this pigment to create a desired color in a food product. Data showed that the stability of this pigment was suitable during thermal processing, pasteurization, baking, and in food matrix at a near neutral pH of 6.6 and a low NaCl content of 0.40% w/w.
Acknowledgments
The authors would like to thank Plant Improvement and Seed Production Research Center, Isfahan (Khorasgan) Branch, Isfahan, Islamic Azad University, Isfahan, Iran.
Author Contributions
Conceptualization: Mahshid Jahadi; Methodology: Niloofar Shafieiyoun, Mahshid Jahadi, and Kianoush Khosravi-Darani; software: Mahshid Jahadi; validation: Kianoush KhosraviDarani; Analysis: Mahshid Jahadi and Kianoush KhosraviDarani; investigation: Niloofar Shafieiyoun; resources: Mahshid Jahadi; data curation: Niloofar Shafieiyoun, Mahshid Jahadi, and Kianoush Khosravi-Darani; preparation and writing of original draft: Niloofar Shafieiyoun, Mahshid Jahadi, and Kianoush Khosravi-Darani; review and editing, Niloofar Shafieiyoun, Mahshid Jahadi, and Kianoush Khosravi-Darani; supervision: Mahshid Jahadi; and project administration: Niloofar Shafieiyoun, Mahshid Jahadi, and Kianoush Khosravi-Darani.
Conflict of Interest
The authors stated that they had no conflict of interest to declare.
Data Availability
The raw/processed data required to reproduce these findings cannot be shared at this time as the data also form part of an ongoing study.
Funding
This study was supported by the National Nutrition and Food Technology Research Institute by number 21251 Tehran, Iran.
REFERENCES
Abdollahi F., Jahadi M., and Ghavami M. 2021. Thermal stability of natural pigments produced by Monascus purpureus in submerged fermentation. Food Sci Nutrit. 021: 1–8. 10.1002/fsn3.2425
Ansarifard F., Islami H.R., Mehrjan M.S., and Soltani M. 2017. The effect of dietary supplement spirulina (Arthrospira platensis) on the immune system and blood biochemical factors of Koi fish (Cyprinuscarpiocarpio). Iran Sci Fish J. 26(3): 23–32. 10.3382/ps/pey093
Antelo F.S., Costa J.A., and Kalil S.J. 2008. Thermal degradation kinetics of the phycocyanin from spirulina platensis. Biochem Eng J. 41(1): 43–7. 10.1016/j.bej.2008.03.012
Banayan S., Jahadi M., and Khosravi-Darani K. 2022. Pigment productions by Spirulina platensis as a renewable resource. J Appl Biotechnol Rep. 9(2): 614–21. 10.30491/JABR.2021.292076.1406
Barbiroli A., Marengo M., Fessas D., Ragg E., Renzetti S., Bonomi F., et al. 2017. Stabilization of beta-lactoglobulin by polyols and sugars against temperature-induced denaturationinvolves diverse and specific structural regions of the protein. Food Chem. 234: 155–62. 10.30491/JABR.2021.292076.1406
Beheshtipour H., Haratian P., Mortazavian A.M., and KhosraviDarani K. 2012. Effects of Chlorella vulgaris and Arthrospira platensis addition on viability of probiotic bacteria in yogurt and its biochemical properties, Eur Food Res Technol. 235: 719–28. 10.1007/s00217-012-1798-4
Beheshtipour H., Mortazavian A.M., Mohammadi R., Sohrabvandi S., and Khosravi-Darani K. 2013. Supplementation of Spirulina platensis and Chlorella vulgaris algae into probiotic Fermented Milks. Comp Rev Food Sci Food Safety. 12 (2): 144–54. 10.1111/1541-4337.12004
Chaiklahan R., Chirasuwan N., and Bunnag B. 2012. Stability of phycocyanin extracted from spirulina sp.: influence of temperature, pH and preservatives. Proc Biochem. 47(4): 659–64. 10.1016/j.procbio.2012.01.010
Chen F., and Zhang Y. 1997. High cell density mixotrophic culture of Spirulina platensis on glucose for phycocyanin production using a fed-batch system. Enzyme Microb Technol. 20(3): 221–4. 10.1016/S0141-0229(96)00116-0
Doke J.M. 2005. An improved and efficient method for the extraction of phycocyanin from spirulina sp. Int J Food Eng. 1(5): 10.2202/1556-3758.1037
Fernández-Rojas B., Hernández-Juárez J., and Pedraza-Chaverri J. 2014. Nutraceutical properties of phycocyanin. J Funct Foods. 11: 375–92. 10.1016/j.jff.2014.10.011
Ferreira-Santos P., Nunes R., De Biasio F., Spigno, Gorgoglione G.D., Teixeira J.A., et al. 2020. Influence of thermal and electrical effects of ohmic heating on C-phycocyanin properties and bio-compounds recovery from Spirulina platensis. Food Sci Technol (LWT). 128: 109491.
Gami B., Naik A., and Patel B. 2011. Cultivation of spirulina species in different liquid media. J Algal Biomass Utilizat. 2(3): 15–26. 10.1016/j.lwt.2020.109491
Ghaeni M., Roomiani L., and Moradi, Y. 2014. Evaluation of Carotenoids and Chlorophyll as Natural Resources for Food in Spirulina Microalgae. Applied Food Biotechnology, 2(1), 39–44. 10.22037/afb.v2i1.7210
Hadiyanto A., Christwardana M., and Sutanto H. 2019. Effects of sugar addition on the thermal degradation of phycocyanin from spirulina sp. Food Biosci J. 3:102–110. 10.1016/j.fbio.2018.01.007
Hoseini S.M., Khosravi-Darani K., and Mozafari M.R. 2013b. Nutritional and medical applications of spirulina microalgae. Minirev Med Chem. 13: 1231–7. 10.2174/1389557511313080009
Hoseini S.M., Shahbazizadeh S., Khosravi-Darani K., and Mozafari M.R. 2013a. Spirulina paltensis: Food and Function, Current Nutrition & Food Science, 9(3): 189-193. 10.2174/1573401311309030003
Li J., Li X.D., Zhang Y., Zheng Z.D., Qu Z.Y., Liu M., et al. 2013. Identification and thermal stability of purple-fleshed sweet potato anthocyanins in aqueous solutions with various pH values and fruit juices. Food Chem. 136(3–4): 1429–34. 10.1016/j.foodchem.2012.09.054
Martelli G., Folli C., Visai L., Daglia M., and Ferrari D. 2014. Thermal stability improvement of blue colorant C-Phycocyanin from Spirulina platensis for food industry applications. Proc Biochem. 49(1): 154–9. 10.1016/j.procbio.2013.10.008
Massoud R., Khosravi-Darani K., Nakhsaz F., and Varga L. 2015. Evaluation of physico-chemical, microbiological and sensory properties of croissants fortified with Arthrospira platensis (spirulina). Czech J Food Sci. 34(4): 350–5 10.17221/289/2015-CJFS
Mazinani S., Fadaei V., and Khosravi-Darani K. 2016. Impact of Spirulina platensis on physicochemical properties and viability of Lactobacillus acidophilus of Probiotic UF feta cheese. J Food Proc Preserv. 40(6): 1318–24. 10.1111/jfpp.12717
Pan-utai W., Poopat N., and Parakulsuk P. 2020. Photoautotrophic cultivation of Arthrospira maxima for protein accumulation under minimum nutrient availability. Appl Food Biotechnol. 7(4), 225–234. 10.22037/afb.v7i4.30353
Priatni, S. 2015. Encapsulation and stability study of Monascus fermented rice extract. Procedia Chem. 17: 189–93. 10.1016/j.proche.2015.12.118
Safari R., Raftani-Amiri Z., and Esmaeilzadeh-Kenari R. 2018. Evaluation of the effect of temperature, time and pH on stability of phycocyanin extracted from Spirulina platensis. Iran Sci Fish J. 26(5): 85–93. 10.22092/ISFJ.2017.115342
Santiago-Morales I.S., Trujillo-Valle L., Márquez-Rocha F.J., and López Hernández J.F. 2018. Tocopherols, phycocyanin and superoxide dismutase from microalgae: as potential food anti-oxidants. Appl Food Biotechnol. 5(1), 19–27. 10.22037/afb.v5i1.17884
Sarada R.M., Pillai M.G., and Ravishankar G.A. 1999. Phycocyanin from spirulina sp: influence of processing of biomass on phycocyanin yield, analysis of efficacy of extraction methods and stability studies on phycocyanin. Proc Biochem. 34(8): 795–801. 10.1016/S0032-9592(98)00153-8
Soheili M., Rezaei K., Mortazavi A., Khosravi-Darani K., Hashemi M., Komeili R., et al. 2013. Phycocyanin production by Spirulina platensis. Iran J Nutr Sci Food Technol. 7(5): 787–797. http://nsft.sbmu.ac.ir/article-1-1080-en.html
Vendruscolo F., Müller B.L., Moritz D.E., de Oliveira D., Schmidell W., and Ninow J.L. 2013. Thermal stability of natural pigments produced by Monascus ruber in submerged fermentation. Biocatal Agric Biotechnol. 2(3): 278–84. 10.1016/j.bcab.2013.03.008
Wang L., Zhao Y., Zhou Q., Luo C.L., Deng A.P., Zhang Z.C., and Zhang J.L. 2017. Characterization and hepatoprotective activity of anthocyanins from purple sweet potato (Ipomoea batatas L. cultivar Eshu No. 8). J Food Drug Anal. 25(3): 607–18. 10.1016/j.jfda.2016.10.009
Zeng X., Danquah M.K., Zhang S., Zhang X., Wu M., Chen X.D., et al. 2012. Autotrophic cultivation of Spirulina platensis for CO2 fixation and phycocyanin production. Chem Eng J. 183: 192–7. 10.1016/j.cej.2011.12.062